Recent Default and Impairment Statistics
For a glimpse at the most current default picture as of this writing, we turn first to data collected by Municipal Market Advisors.6 MMA’s numbers include all outstanding, uncured default situations that have been disclosed since at least July 2009 (any default situation with no posted notice in the last two years would not be included).
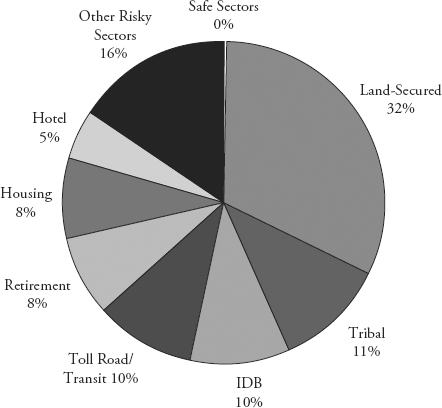
As of 9/30/2011, according to MMA, an estimated $8.8 billion of muni debt was in monetary default, with the land-based category accounting for 32 percent of the total. Native American tribal debt was the next largest default contributor at about 11 percent, followed by industrial development bonds (IDB) at 10.4 percent. See Figure 4.4.
As mentioned above, MMA also maintains a record of credit impairment notices other than monetary defaults, such as notices of “support” (where bondholders are being paid through emergency means, e.g., reserve fund, bond insurance, LOC draw, etc.) and a catch-all “other” category (where debt service is being paid in the regular way, but there is trouble afoot through covenant violation, bankruptcy, developer problems, etc.). Combining all credit impairments, including monetary defaults, produces a somewhat different picture. Again as of 9/30/2011, a total of $36.26 billion in municipal ...
Get Investing in the High Yield Municipal Market: How to Profit from the Current Municipal Credit Crisis and Earn Attractive Tax-Exempt Interest Income now with the O’Reilly learning platform.
O’Reilly members experience books, live events, courses curated by job role, and more from O’Reilly and nearly 200 top publishers.

