12
Technical Analysis I: Charting Tools
Chapter Query
The daily opening share price of Reliance Industries for January 2001 to December2001 shows the following pattern. Do you think September 2001 was the right time to buy the share?
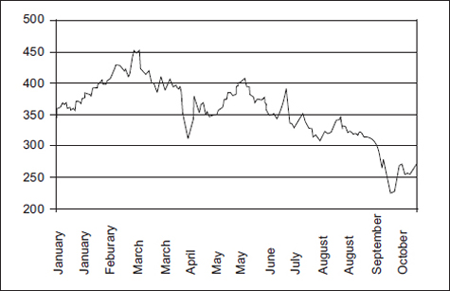
Figure 12.1 Reliance Industries
Chapter Goal
The movements of share price are a huge quantum of information that is available to investors. The usage of this information is introduced in this chapter. The chapter explains technical analysis and illustrates the line chart, volumechart, barchart, candlestick chart, and point and figure chart that are used by technical analysts to make an investment decision. ...
Get Investment Analysis and Portfolio Management now with the O’Reilly learning platform.
O’Reilly members experience books, live events, courses curated by job role, and more from O’Reilly and nearly 200 top publishers.

