Chapter 13
Creating Three-Dimensional Scatterplots
Using the Scatterplot 3D Platform
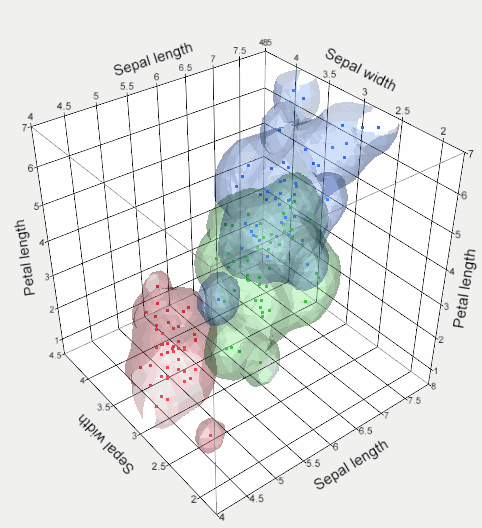
The Scatterplot 3D platform shows the values of numeric columns in the associated data table in a rotatable, three-dimensional view. Up to three columns that you select from the associated data table are displayed at one time. See Figure 13.1.
To help visualize variation in higher dimensions, the 3D scatterplot can show a biplot representation of the points and variables when you request principal components. The most prominent directions of data are displayed on the 3D scatterplot report.
Figure 13.1 Example of a 3D Scatterplot

Get JMP 10 Basic Analysis and Graphing, Second Edition now with the O’Reilly learning platform.
O’Reilly members experience books, live events, courses curated by job role, and more from O’Reilly and nearly 200 top publishers.

