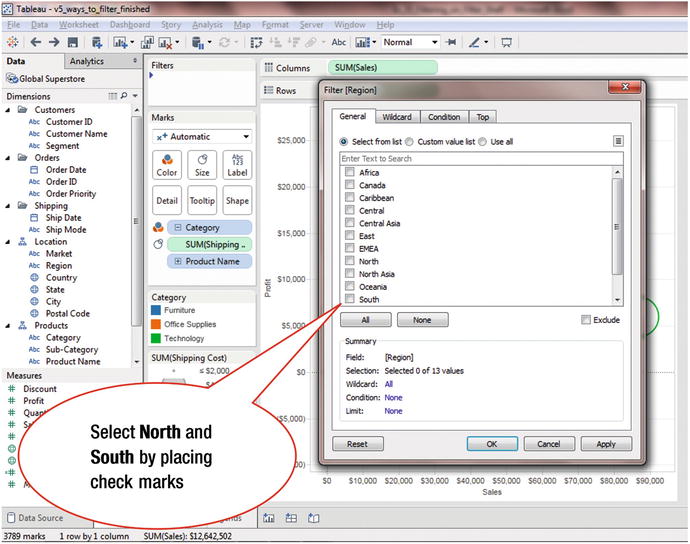
Objective: This exercise demonstrates how to filter using the Filter shelf
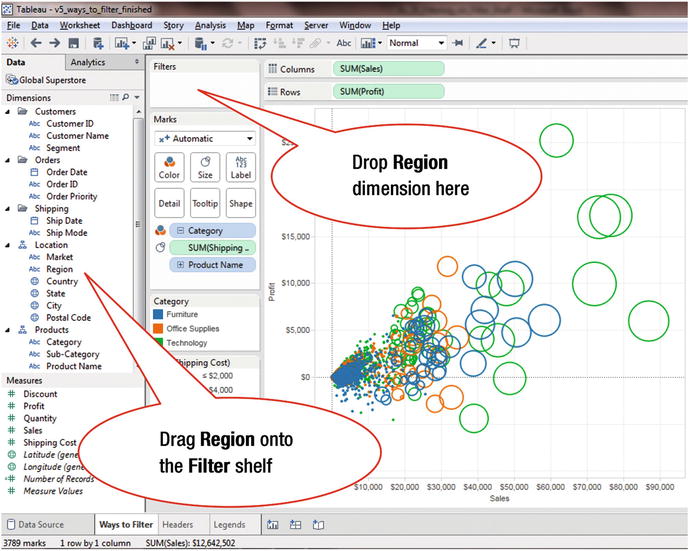
Figure 19-1 shows a chart that plots the sum of sales against the sum of profits.
© Arshad Khan 2016
Arshad Khan, Jumpstart Tableau, 10.1007/978-1-4842-1934-8_19
Arshad Khan1
(1)Fremont, California, USA
Objective: This exercise demonstrates how to filter using the Filter shelf
Figure 19-1 shows a chart that plots the sum of sales against the sum of profits.
Get Jumpstart Tableau: A Step-By-Step Guide to Better Data Visualization now with the O’Reilly learning platform.
O’Reilly members experience books, live events, courses curated by job role, and more from O’Reilly and nearly 200 top publishers.
Get Mark Richards’s Software Architecture Patterns ebook to better understand how to design components—and how they should interact.

Dive in for free with a 10-day trial of the O’Reilly learning platform—then explore all the other resources our members count on to build skills and solve problems every day.
Start your free trial Become a member now