Objective: This exercise demonstrates how to display and save the data associated with a displayed visualization
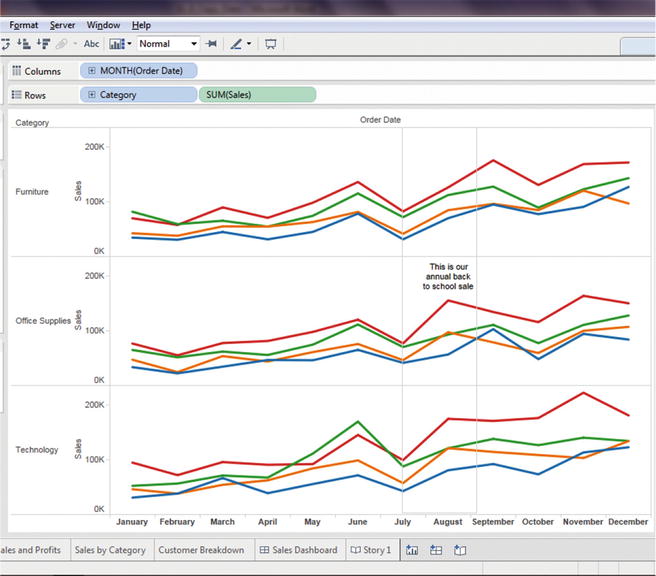
Figure 27-1 shows the visualization whose data needs to be displayed.

Figure 27-1. Visualization for which underlying data is to be viewed
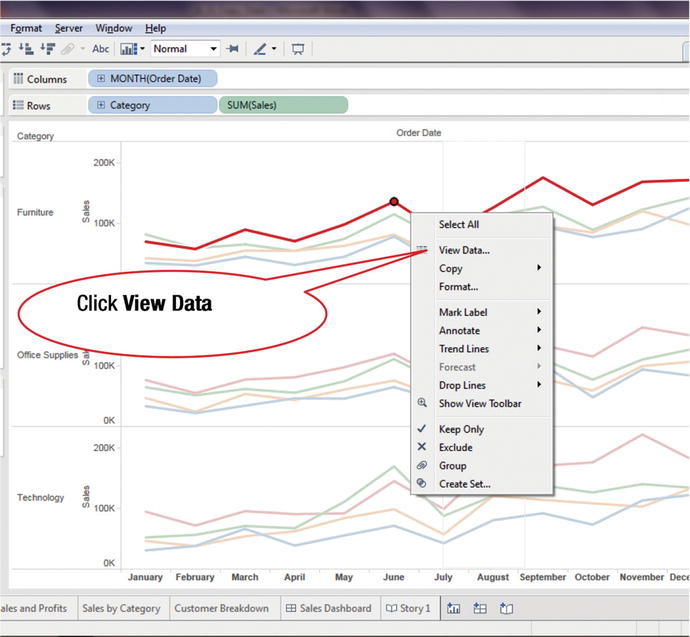
Right-click within the chart area, which pops up the menu tree displayed in Figure 27-2

Figure 27-2. Menu tree with View Data option
Click View Data, as shown in Figure ...

