© Arshad Khan 2016

Arshad Khan, Jumpstart Tableau, 10.1007/978-1-4842-1934-8_31

31. Highlighting with Colors

Arshad Khan

(1)Fremont, California, USA

Objective: This exercise demonstrates how to highlight the data in the visualization using color

We start this exercise with Figure 31-1, which displays crosstab data.

A416394_1_En_31_Fig1_HTML.jpg
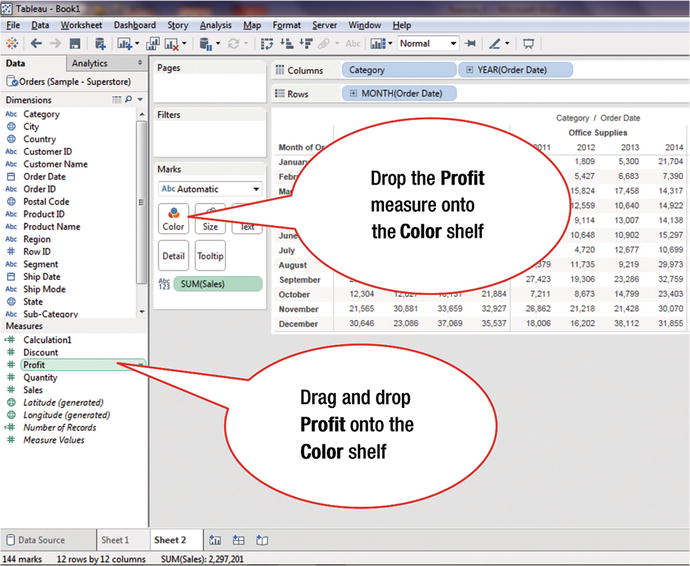
Figure 31-1. View with crosstab data

To analyze the profits:

  • Drag and drop Profit onto the Color shelf in the Marks card, as shown in Figure 31-1, which leads to the display shown in Figure 31-2

    A416394_1_En_31_Fig2_HTML.jpg
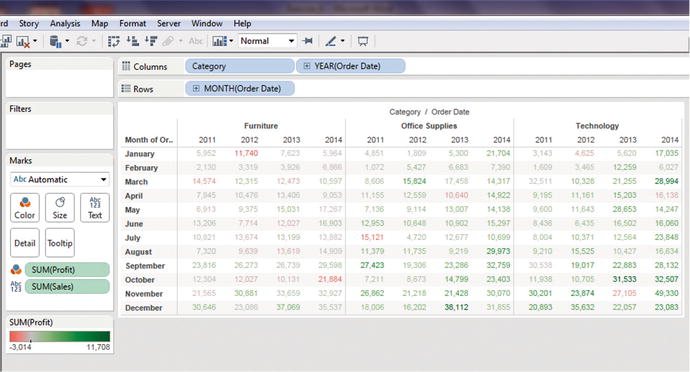
    Figure 31-2. Numbers displayed in color

When ...

Get Jumpstart Tableau: A Step-By-Step Guide to Better Data Visualization now with the O’Reilly learning platform.

O’Reilly members experience books, live events, courses curated by job role, and more from O’Reilly and nearly 200 top publishers.