ARIMA
ARIMA stands for autoregressive integrated moving average models. Generally, it is defined by the equation ARIMA(p, d, q).
Here,
- p is the order of the autoregressive model
- d is the order required for making the series stationary
- q is the order of moving average
The very first step in ARIMA is to plot the series, as we need a stationary series for forecasting.
So let us first plot the graph of the series by executing the following code:
> PriceData<-ts(StockData$Adj.Close, frequency = 5)
> plot(PriceData)
This generates the following plot:
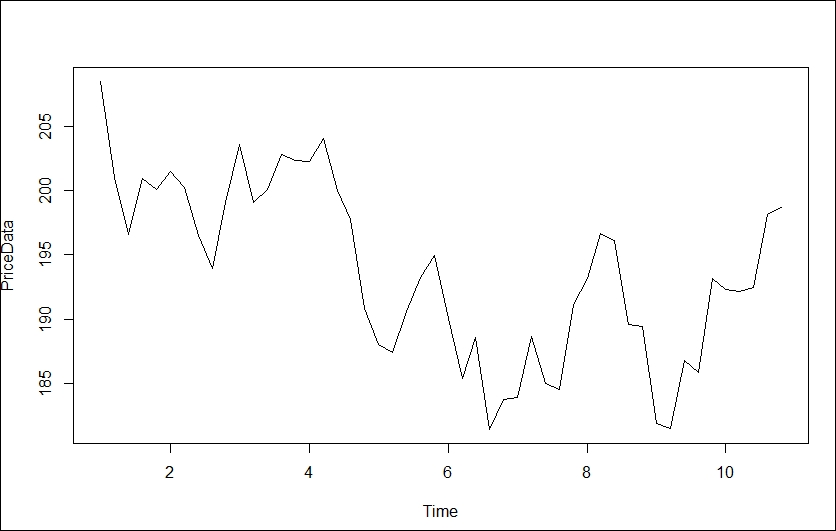
Figure 4.9: Plot of price data
Clearly, upon inspection, the series seems to be nonstationary, so we need to ...
Get Learning Quantitative Finance with R now with the O’Reilly learning platform.
O’Reilly members experience books, live events, courses curated by job role, and more from O’Reilly and nearly 200 top publishers.

