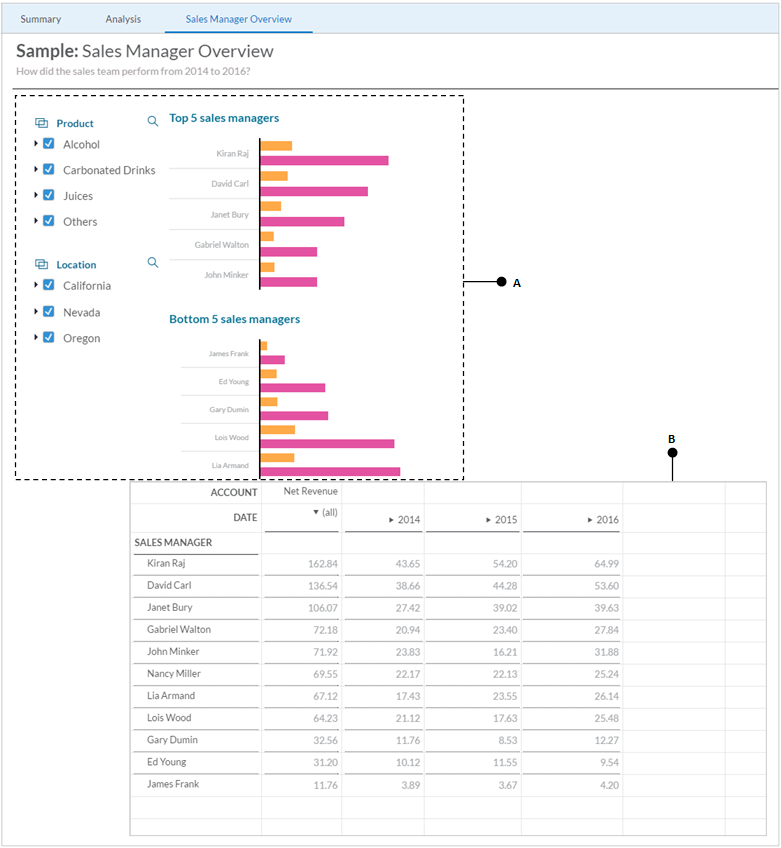
After completing the Summary and Analysis pages in which you added some useful objects to visualize data, here is the third one--Sales Manager Overview. As the name implies, this page will have objects to analyze the performance of the sales team. Some of the objects to be created on this page (filters and bar charts (A)) are already known to you. The table object (B) is the one that is new to this chapter. A table is a spreadsheet-like object that can be used to view and analyze text data. You can add this object to either canvas or grid pages in stories, as shown in the following screenshot:
In addition to the ...

