In addition to the anomaly in the transactions processed KPI (in which an unexpected dip occurs), the other three ML jobs (for the network metrics, the application logs, and the SQL database metrics) were superimposed on the same time frame in the Anomaly Explorer. The following screenshot shows the results of this:
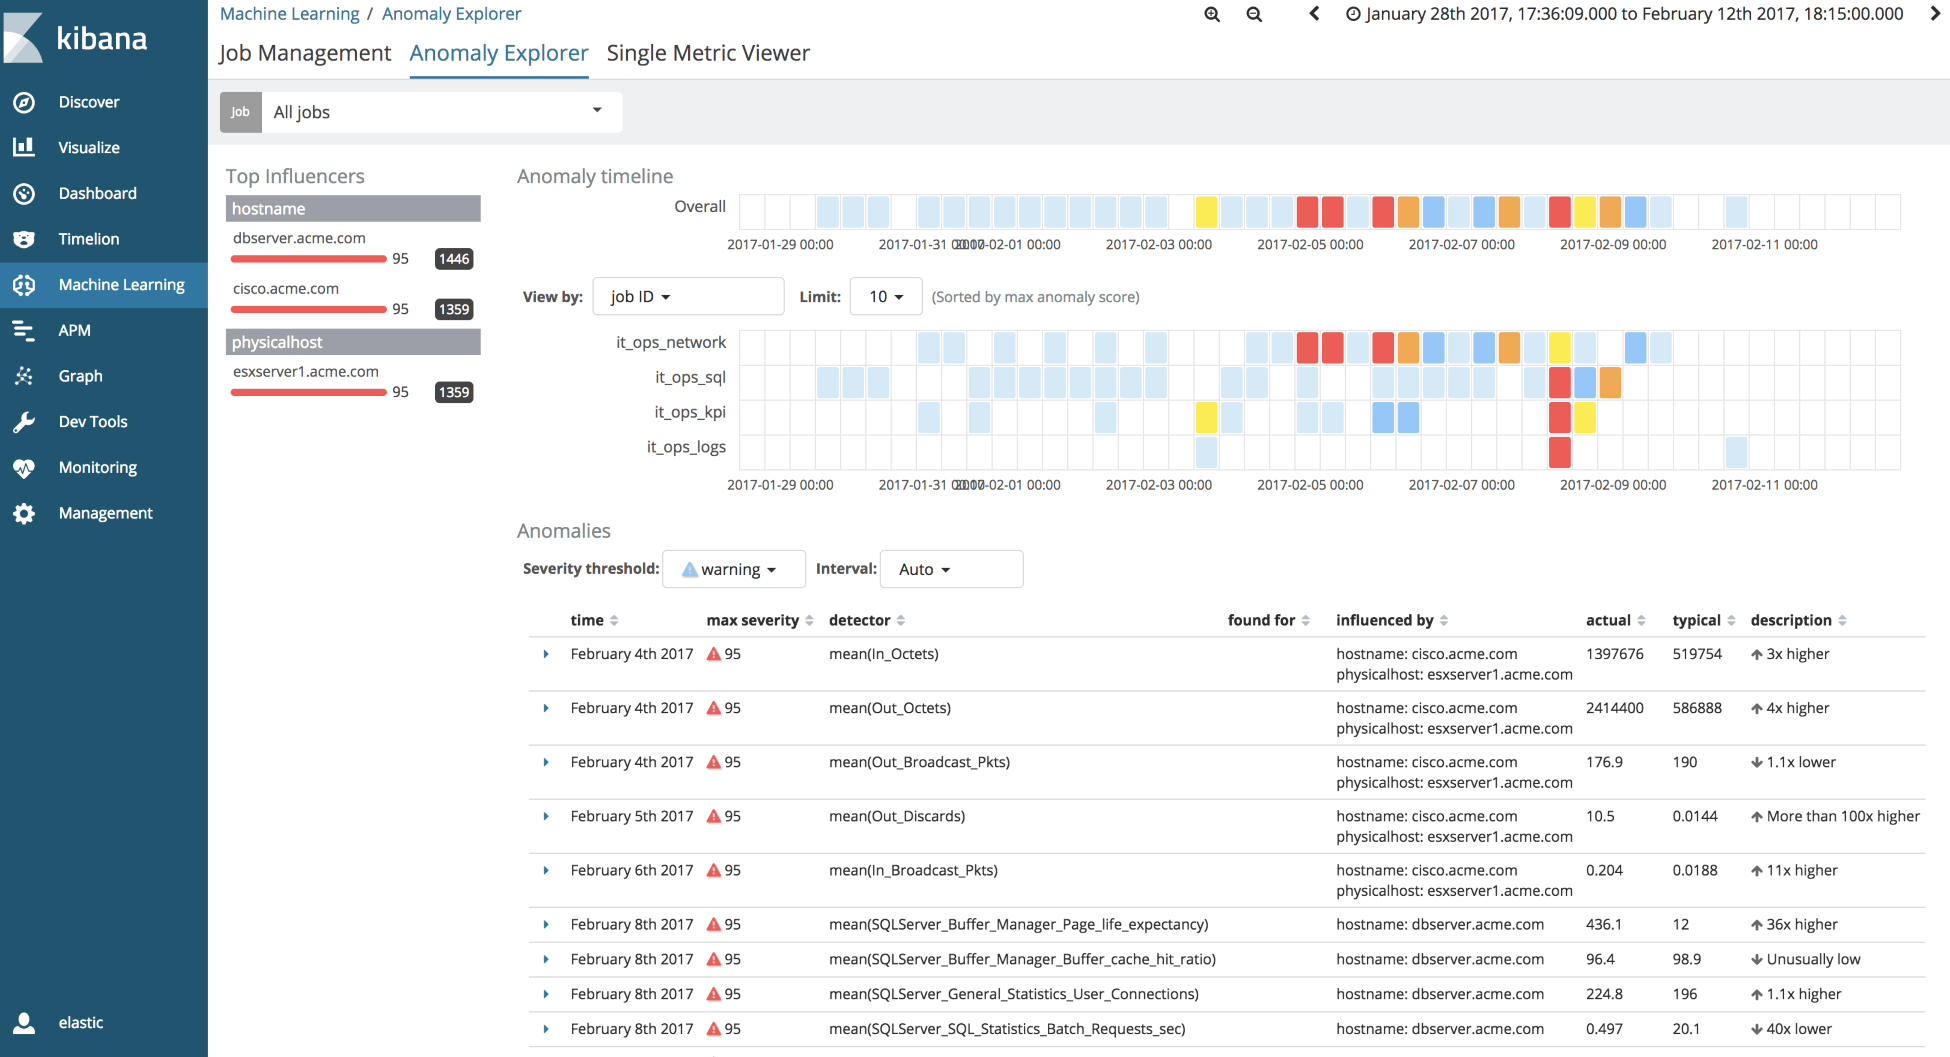
Notice that during the time the KPI was exhibiting problems on February 8th 2017, the three other jobs also showed correlated anomalies (see the vertical stripe of significant anomalies in the annotated red circle across all four jobs). Upon closer inspection (by clicking on the red tile ...

