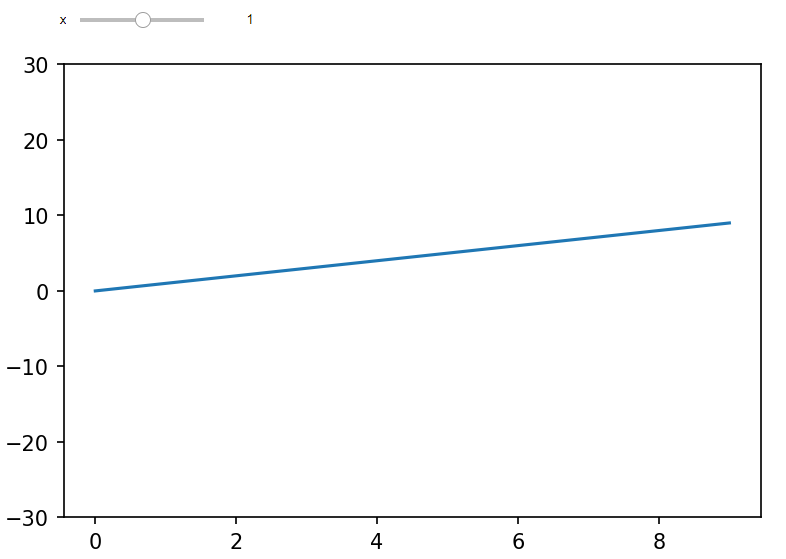
By using the interact method and setting 'x' to 1 by default we get the following points:
- The little widget pops up automatically, just above the plot:
# Basic interact usage with integer sliderdef f(x): plt.plot(np.arange(0,10), x*np.arange(0,10)) plt.ylim(-30,30)interact(f, x=1)
We will get the following output:

- Without having to do any extra coding, except for this one very simple function, we actually get an interactive plot. This widget changes the slope of the plot automatically, based on the fact that this argument is an integer. As we change the slider, the line automatically ...

