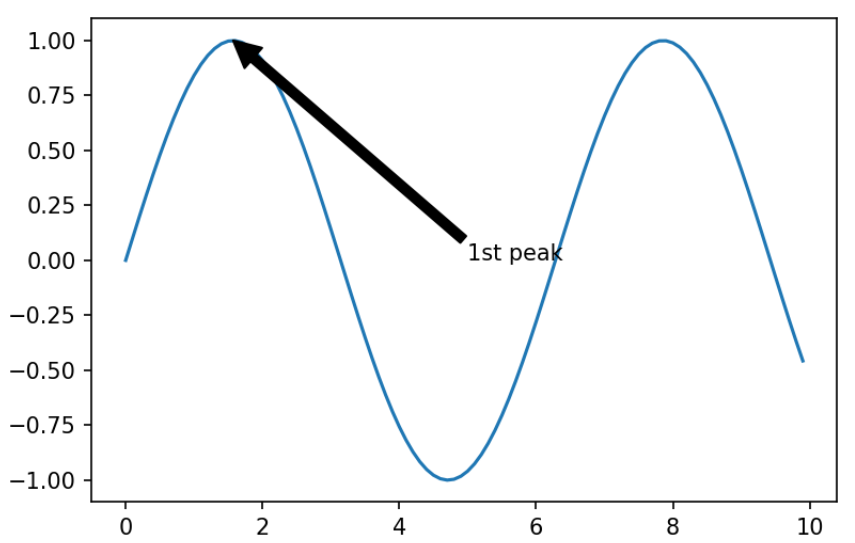
We will add some text under the arrow, as shown in the following points:
- Change the empty string to a string that says 1st peak:
# Add textnums = np.arange(0,10,0.1)plt.plot(nums, np.sin(nums))plt.annotate("1st peak", xy=(np.pi/2, 1), xytext=(5,0), arrowprops=dict(facecolor='k'))
We will thus get some text that begins at (5, 0), and the tip of our arrow pointing at PI over (2, 1):

- This text takes all of the usual keyword arguments that the text method itself takes, so we will include color= red, weight =bold, style=italic, and all of those will be passed on, as follows:
# Customize textnums = np.arange(0,10,0.1) ...

