Follow along the exercise steps:
- In a new worksheet, create a calculated field named Window_AVG with the following code:
WINDOW_AVG(SUM([Sales]))
- Place Region on the Columns shelf, Sales on the Rows shelf, and Window Avg on the Rows shelf.
- Select the Window Avg pane in the Marks View Card and add State to the Detail shelf.
- Right-click on Window Avg and select Compute Using > State.
- Select the Window Avg pane in the Marks View card and select Gantt Bar as the view type:
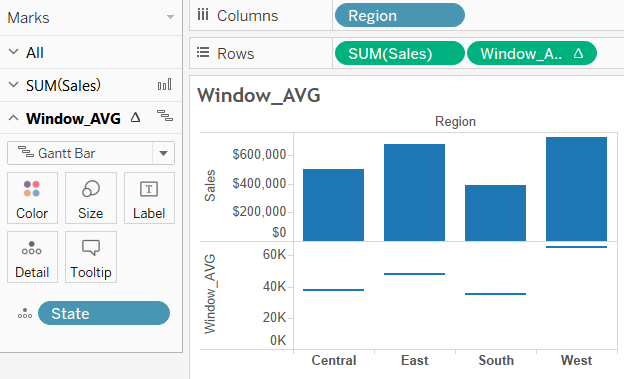
- Adjust the color of the Gantt Bar to contrast with the bar chart associated with SUM(Sales).
- Right-click on ...

