Chapter 5. Adding Tables, Charts, and Diagrams
Chapter at a Glance
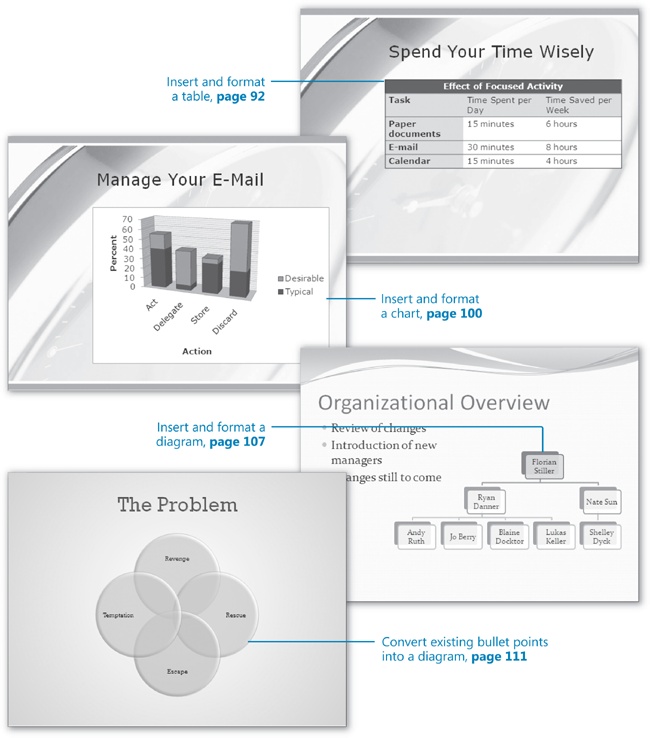
Often you will want to bolster the argument you are making in a Microsoft Office PowerPoint 2007 presentation with facts and figures that are best presented in a table, chart, or diagram. Graphic objects such as these serve the following purposes:
Tables condense information into highly structured row and column grid formats so that identifying categories or individual ...
Get Microsoft® Office PowerPoint 2007 Step by Step now with the O’Reilly learning platform.
O’Reilly members experience books, live events, courses curated by job role, and more from O’Reilly and nearly 200 top publishers.

