Skip to Content
Microsoft Power BI によるデータの視覚化
book

Microsoft Power BI によるデータの視覚化

by Alex Kolokolov, Maxim Zelensky
March 2025
Beginner to intermediate
416 pages
6h 16m
Japanese
O'Reilly Media, Inc.
Content preview from Microsoft Power BI によるデータの視覚化

第16章 ガントチャート ガントチャート

この作品はAIを使って翻訳されている。ご意見、ご感想をお待ちしている:translation-feedback@oreilly.com

練習については、このデータセットをダウンロードしてほしい。

このチャート( )は、個々のタスクの進捗状況やプロジェクト全体のタイムラインを把握するための貴重なツールとして、プロジェクトマネージャーに高く評価されている。このチャートは、プロジェクトのマイルストーンと期限を効率的に監視できる視覚的な表現を提供する。

左側(図 16-1)には、この図に関連するプロジェクトやタスクのリストがある。チャートの上部は時間軸を表している。各タスクは個別のバーで表され、バーの長さは対応するタスクの期間に比例する。それぞれのバーの内側には、それぞれのタスクの完了を示す塗りつぶしがある。垂直の破線は現在の日付を示し、チャート上の時間的な基準点を示す。

図16-1. Microsoftによるガント・チャートのサンプル

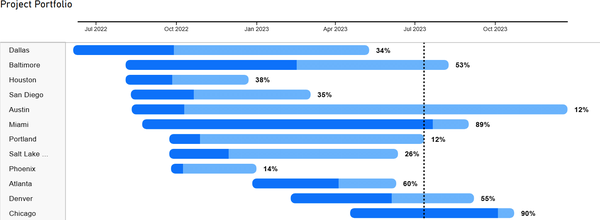
図16-1は、かなり簡潔な視覚的要約を示している。しかし、一般的にガントチャートには、数百から数千の行のタスクとサブタスク、そしてそれらに対応する関係と依存関係が含まれる。

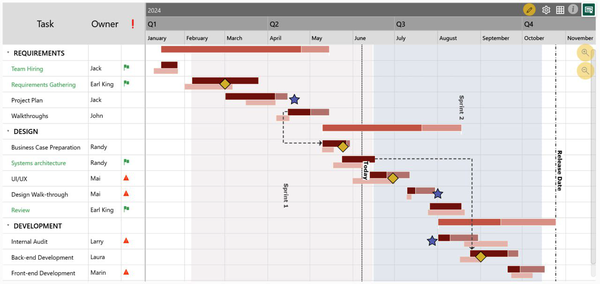
図16-2は、xViz ベンダによる、より複雑なサンプルであり、Microsoft Projectやその他の類似プラットフォームのような、専門的なプロジェクト管理システムのインタフェースによく似ている。プロジェクトのネットワークグラフが何十ページにもわたって印刷されているのを見たことがあるだろう。

図16-2 xVizによるガントチャートのサンプル xVizによるガントチャートのサンプル

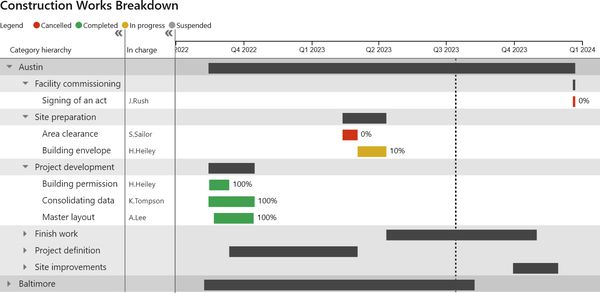
ダッシュボードは、簡単な概要と追加の質問に対する回答を同時に提供する必要がある 。図16-3は、MAQソフトウェア( )によるビジュアルで構築された、中複雑なガントの例である。

図16-3. MAQソフトウェアによるガントチャートのサンプル

AppSourceギャラリーには10以上の異なるバージョンのガントチャートがあり、この章ではそのうちの2つを紹介する。いつものように、Power BIの開発元であるMicrosoftが提供するビジュアルから始める。次に、MAQソフトウェアが提供する、より複雑なビジュアルを紹介する。両者には共通の原則があり、それをガイドで説明する。この情報に基づいて、他のバージョンのガントとの連携方法を理解することができるだろう。

Microsoftによるガントチャート

複雑で制限の多かったウォーターフォールチャートとは異なり、Microsoftのガントチャート は最もシンプルでわかりやすい選択肢であり、もちろん無料だ。私たちはこれを、シンプルと階層の2つのオプションに分けた。技術的には、これらは同じビジュアルであり、フィールドとソースデータのセットが異なるだけである。まずはシンプルなオプションから始めて、より洗練されたオプションに移ることにしよう。 ...

Become an O’Reilly member and get unlimited access to this title plus top books and audiobooks from O’Reilly and nearly 200 top publishers, thousands of courses curated by job role, 150+ live events each month,
and much more.

Read now

Unlock full access

More than 5,000 organizations count on O’Reilly

AirBnbBlueOriginElectronic ArtsHomeDepotNasdaqRakutenTata Consultancy Services

QuotationMarkO’Reilly covers everything we've got, with content to help us build a world-class technology community, upgrade the capabilities and competencies of our teams, and improve overall team performance as well as their engagement.
Julian F.
Head of Cybersecurity
QuotationMarkI wanted to learn C and C++, but it didn't click for me until I picked up an O'Reilly book. When I went on the O’Reilly platform, I was astonished to find all the books there, plus live events and sandboxes so you could play around with the technology.
Addison B.
Field Engineer
QuotationMarkI’ve been on the O’Reilly platform for more than eight years. I use a couple of learning platforms, but I'm on O'Reilly more than anybody else. When you're there, you start learning. I'm never disappointed.
Amir M.
Data Platform Tech Lead
QuotationMarkI'm always learning. So when I got on to O'Reilly, I was like a kid in a candy store. There are playlists. There are answers. There's on-demand training. It's worth its weight in gold, in terms of what it allows me to do.
Mark W.
Embedded Software Engineer

You might also like

Microsoft Power BI による人工知能

Microsoft Power BI による人工知能

Jen Stirrup, Thomas J. Weinandy

Publisher Resources

ISBN: 9798341633377