This chapter got you up and running, and illustrated how easy it is
to use Pythonâs interactive interpreter to explore and visualize Twitter
data. Before you move on to other chapters, itâs important that you feel
comfortable with your Python development environment, and itâs highly
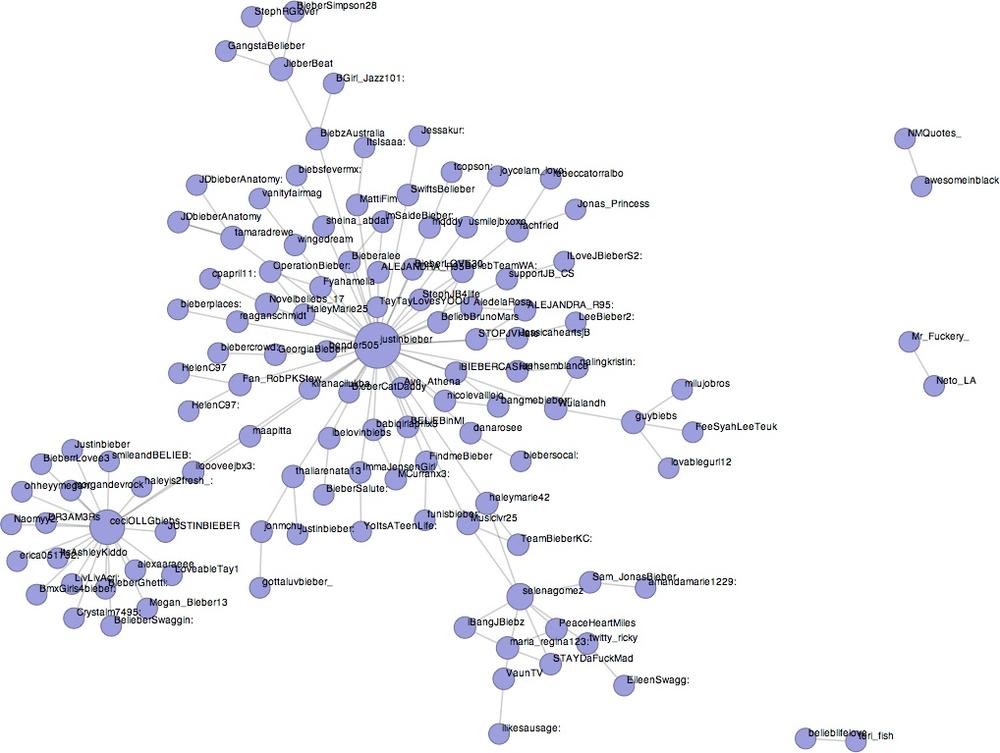
recommended that you spend some time with the Twitter APIs and Graphviz.
If you feel like going out on a tangent, you might want to check out
canviz, a project
that aims to draw Graphviz graphs on a web browser
<canvas> element. You might also want to investigate
IPython, a âbetterâ
Python interpreter that offers tab completion, history tracking, and more.
Most of the work weâll do in this book from here on out will involve
runnable scripts, but itâs important that youâre as productive as possible
when trying out new ideas, debugging, etc.
Get Mining the Social Web now with the O’Reilly learning platform.
O’Reilly members experience books, live events, courses curated by job role, and more from O’Reilly and nearly 200 top publishers.

