126 Mining Your Own Business in Telecoms Using DB2 Intelligent Miner for Data
6.6.2 CVF
As described earlier, the steps to generate customer values for each customer
are:
Using IM for Data application mode, apply the prediction model to your entire
customer database, then you’ll get a credit risk for each customer.
Using IM for Data application mode, apply the behavioral segmentation model
to your entire customer database, assign a segment to each customer, then
you can calculate behavior measure from that.
Based on that credit risk, behavior measure, you’ll get customer values for
each customer using the formula:
CVF = Average (Revenue for each customer, Behavior measure)
multiplied by (Credit score
)
Where, Credit score is 1 - Credit risk.
Now, you can interpret the customer values which are now assigned for your
customer. You can see the distribution associated with customer value to check
whether the customer value is meaningful.
CVF value per each segment
Figure 6-7 shows the distribution of customer value and credit risk and revenue
by each segment. If you look at the segment 4-Night family, which is at the
bottom of the picture in Figure 6-7, customer value distribution is much higher
than revenue and has a relatively high credit score. Night family is a good
customer group in terms of customer value, which may not be found if revenue is
only used as a customer value measurement.
Revenue share compared to credit risk
The revenue was not used as an input variable inside the credit risk prediction
model. However, an inverse relationship between revenue and credit score is
straightforward as shown in Table 6-4. The high revenue share clusters appear,
in average, with high credit risk (low credit score). This important result shows
the dangers of using only revenue as a customer value measure.
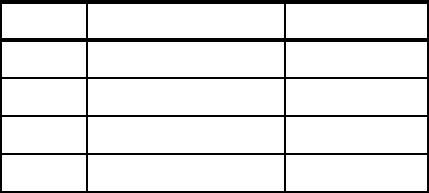
Table 6-4 Segment rank by revenue share and credit score
Rank Revenue share Credit score
1 Segment0 (21.8%) Segment5
2 Segment3 (15.0%) Segment7
3 Segment1 (13.9%) Segment8
4 Segment6 (11.1%) Segment1

Chapter 6. How to discover the true value of your customers 127
Figure 6-7 Bivariate statistics to show CVF value distribution by each segment
5 Segment7 (9.5%) Segment2
6 Segment8 (8.4%) Segment0
7 Segment2 (7.1%) Segment3
8 Segment4 (6.9%) Segment4
9 Segment5 (6.3%) Segment6
Rank Revenue share Credit score
128 Mining Your Own Business in Telecoms Using DB2 Intelligent Miner for Data
Top10% in revenue compared to top10% in CVF value
The customer value function was defined as the average between customer
revenue and behavior value, multiplied by the credit score (1-credit risk). The
comparison between customer ranking by revenue and by CVF value shows the
differences.
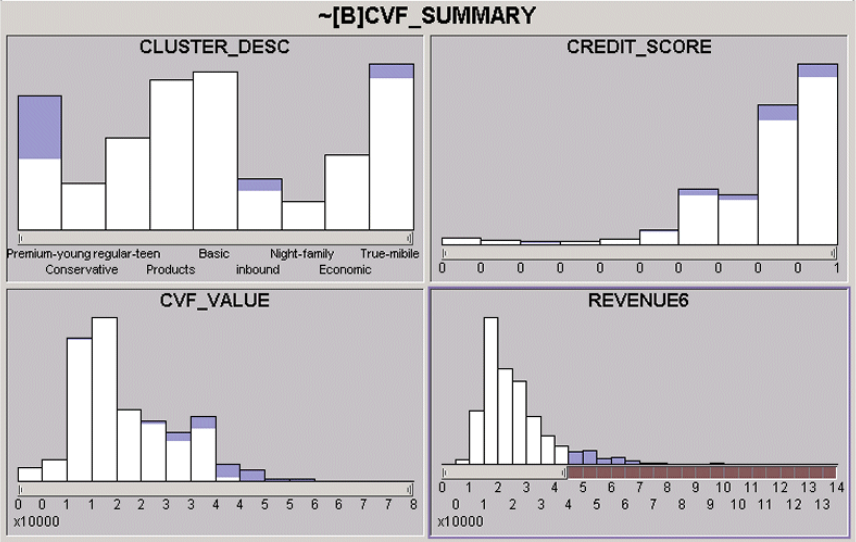
Figure 6-8 and Figure 6-9 are the outputs of Attribute Visualizer, which shows
each variable with the distribution. If you choose a certain range of a specific
variable, it shows the matching distribution of the other variables. For example, if
REVENUE6 >45 is selected (see Figure 6-8, REVENUE6), the matching
distribution automatically appears in other variables (CLUSTER_DESC,
CREDIT_SCORE, CVF_VALUE). In other words, it shows CLUSTER_DESC,
CREDIT_SCORE, and CVF_VALUE distribution of customers whose revenue is
more than 45.
Figure 6-8 shows the top 10% of customers based on revenue (REVENUE>45)
and their distribution across the segments using Attribute Visualizer. They are
distributed mainly in segments 0, 3, and 1, which are premium young, inbound,
and true mobile, respectively.
Figure 6-8 Revenue top 10% distribution across the segments
Chapter 6. How to discover the true value of your customers 129
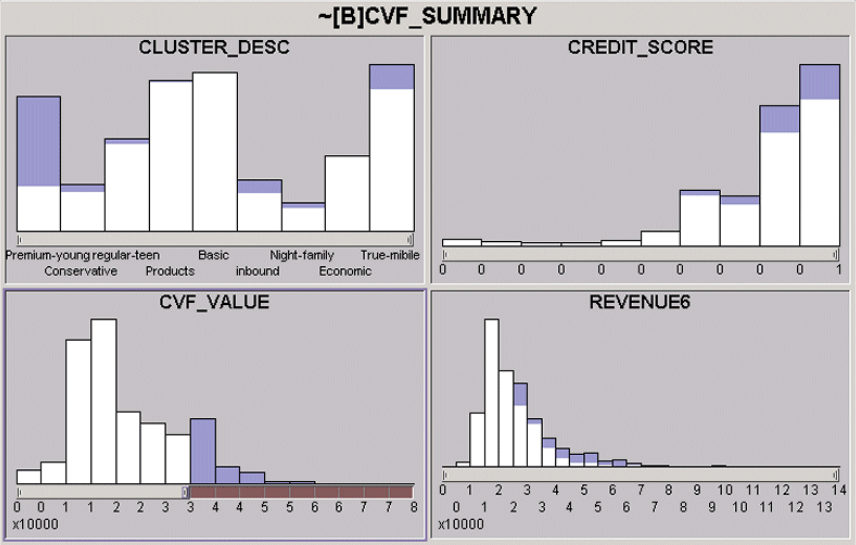
Figure 6-9 shows the distribution of segments for the top 10% customers based
on their CVF value (CVF_VALUE>35). In this case, first CVF_VALUE >35 is
chosen and it shows the matching distribution of other variables. You can see
that the composition of segments are not only 0, 1, 3 (premium young, inbound,
true mobile), but also other segments as well.
Figure 6-9 CVF value top 10% distribution across the segments
The CVF is downgrading the customers with high revenue, but with high credit
risk, and upgrading the customers with low revenue, but good behavior. CVF
value is more precise than the customer revenue (in this particular case,
customer revenue was existing criteria that marketing personnel are using for
customer grading) in a marketing perspective. You can do the further analysis
with CVF value and your existing criteria for measuring customer value.
Get Mining Your Own Business in Telecoms Using DB2 Intelligent Miner for Data now with the O’Reilly learning platform.
O’Reilly members experience books, live events, courses curated by job role, and more from O’Reilly and nearly 200 top publishers.

