Macroeconomics for Dummies
Gross Domestic Product: Between 2000 and 2006 GDP grew at only about 1 percent to 4 percent per year.13 (See Table 12-1 .)
| Year | Current $ | Chained 2005 $ |
|---|---|---|
| 2000 | 5.9 | 3.7 |
| 2001 | 3.2 | 0.8 |
| 2002 | 3.4 | 1.6 |
| 2003 | 4.7 | 2.5 |
| 2004 | 6.9 | 3.9 |
| 2005 | 6.3 | 3.2 |
| 2006 | 6.3 | 3.3 |
[ ] Source: Bureau of Economic Analysis, U.S. Department of Commerce, http://www.bea.gov/ national/xls/gdpchg.xls.
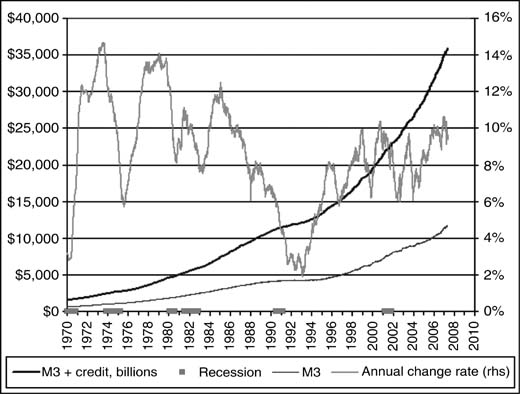
Money Supply: From 1987 to 2005, M3 increased from around $3.5 trillion to over $10 trillion, growing after 1994 at nearly 8 percent—more than twice the rate of GDP growth.
At the end of January 2000, M3 was $6.6 trillion. By the end of January 2006, it was $10.2 trillion. Though M3 reporting ceased on March 23, 2006, it is estimated that another $1 trillion of new money will be added in 2007.14 (See Figure 12-1 .)
Figure 12-1: Growth in M3 plus Credit; 1970–2007. Data Source: Federal Reserve. Source: http://www.nowandfutures.comkey_stats.html.
Assets: The supply of money goosed up the value of global stocks, bonds, and other assets to $140 trillion in 2005, three times the size of total output of good and services that year. In 1980, the ratio of financial assets to GDP stood at about 1.5 to 1. By 2007, it was about 4 to 1. By 2005, global cross‐border capital flows topped $6 trillion, more than double their level in 2002. At the center, the United States took in ...
Get Mobs, Messiahs, and Markets now with the O’Reilly learning platform.
O’Reilly members experience books, live events, courses curated by job role, and more from O’Reilly and nearly 200 top publishers.

