6.11. NICHOLS CHART USING MATLAB [7]
In the previous section, the Nichols chart was illustrated. We superimposed a hand-drawn plot of the open-loop transfer function G(s)H(s) on a pre-drawn and supplied Nichols chart. In this section, the MATLAB utility used for obtaining the Nichols chart is identified, and the reader will be shown how to obtain the Nichols chart very easily and accurately using MATLAB. The control-system engineer does not have to go and find a pre-drawn Nichols chart when using MATLAB. The Nichols chart and the superimposed plot of G(s)H(s) are both created and drawn at the same time.
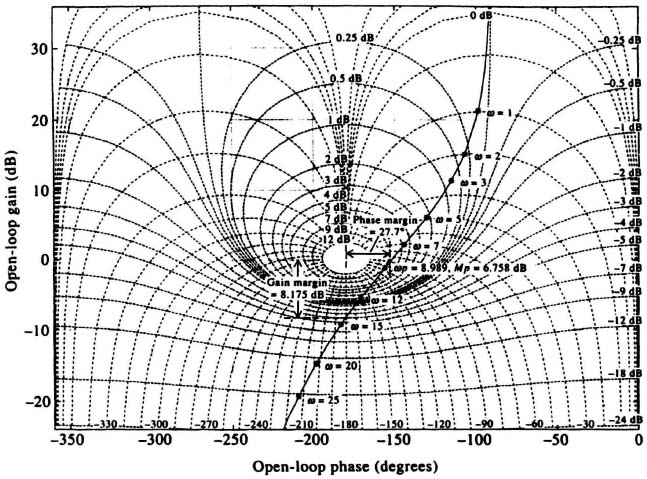
Figure 6.51(a) Nichols chart for the system shown in Figure 6.49.
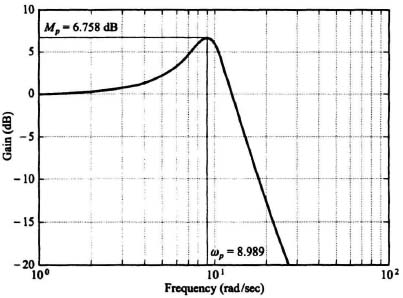
Figure 6.51(b) Closed-loop frequency response of the system shown in Figure 6.49 from the Nichols chart of Figure 6.51a.
The MATLAB Control System Toolbox uses the command nichols to create the Nichols frequency response plot, and it uses the command ngrid to generate the grid lines for a Nichols chart. The MCSTD Toolbox simplifies the process with the comman nichgrid.
The definition of the nichgrid command is as follows:
function[x,y] = nichgrid(g,a,b,n)
where
g = grid values for axis (in degrees and dB)
a = angles (in degrees, − 180° < a < 0)
b = gains (in dB)
n = interpolation value (optional, default = none) ...
Get Modern Control System Theory and Design, 2nd Edition now with the O’Reilly learning platform.
O’Reilly members experience books, live events, courses curated by job role, and more from O’Reilly and nearly 200 top publishers.

