6. Working with Charts
In this chapter, you discover just how easy it is to create and customize charts in Excel 2013. Topics include the following:
→ Altering the source data range
→ Formatting the plot and chart areas
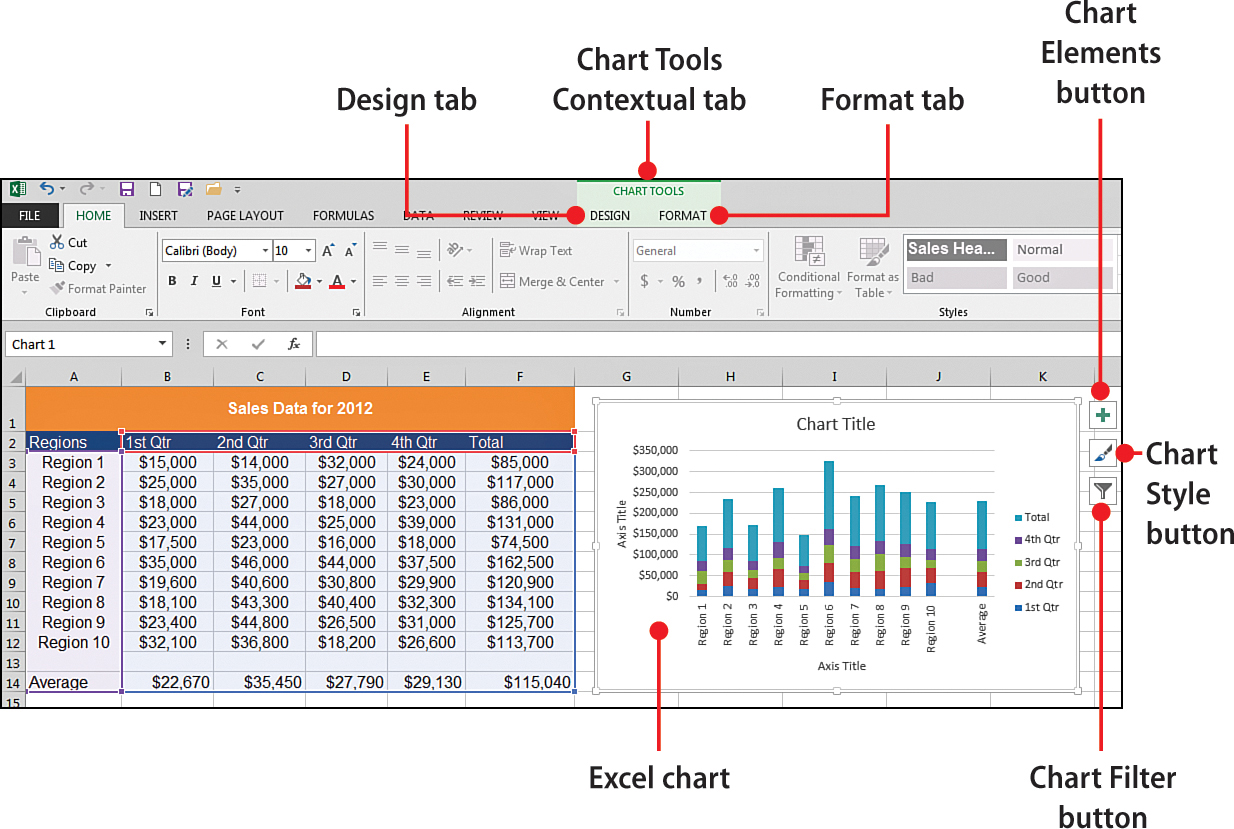
Charts are graphical representations of data that enable you to visualize and communicate your data in a more meaningful way than with simple numbers in tables. In Excel, you not only have the capability to easily chart your data, but you can also quickly change ...
Get My Excel® 2013 now with the O’Reilly learning platform.
O’Reilly members experience books, live events, courses curated by job role, and more from O’Reilly and nearly 200 top publishers.

