3.3 Overview of the Web Interface
If you call the URL http://nagios-server/nagios in the browser when the Nagios daemon is running, you will be taken to the welcome screen shown in Figure 3-1.
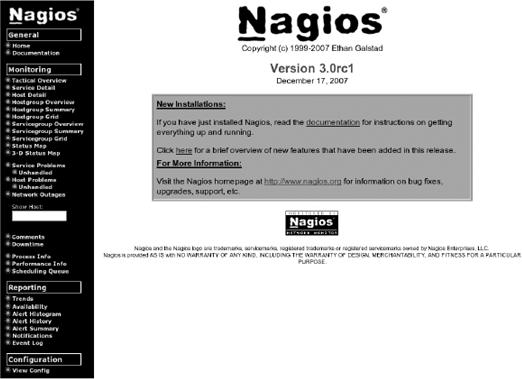
Figure 3-1. The start screen
The so-called "tactical overview" (Tactical Overview), which can be reached via the first monitoring link in the left menu bar, is shown in Figure 3-2. It summarizes the status of all tested systems.
Considerably more interesting in practice, however, is the display of the menu item Service Problems (Figure 3-3). It documents the services that are currently causing problems, those that are not in the OK status, in the very sense for ...
Get Nagios, 2nd Edition now with the O’Reilly learning platform.
O’Reilly members experience books, live events, courses curated by job role, and more from O’Reilly and nearly 200 top publishers.

