Single Option Trade
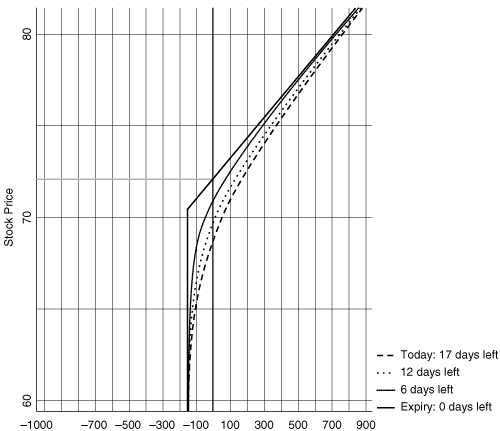
Let’s look at an example of a risk graph to illustrate a trade involving a single long call:
Example 1. This example recalls Example 3 from Chapter 2, “Option Selection.” We use a risk graph to demonstrate how the information provided in that example was determined.
You think that XYZ is going to rise in price in the near to intermediate future. In early April, XYZ is at $67.
You buy 1 Apr 70 call, which is priced at $1.50 per share.
See Figure 5-1 for the risk graph that depicts this trade of being a long one XYZ Apr 70 call with 17 days until the option expires.
In Figure 5-1, the price ...
Get Options for the Beginner and Beyond: Unlock the Opportunities and Minimize the Risks now with the O’Reilly learning platform.
O’Reilly members experience books, live events, courses curated by job role, and more from O’Reilly and nearly 200 top publishers.


