Chapter 12. Trading with the OVI
In this chapter, I summarize my proprietary OVI indicator. For more details and video tutorials, go to my free website, www.theinsideredge.com.
We only use the OVI with continuation patterns and channel breakouts.
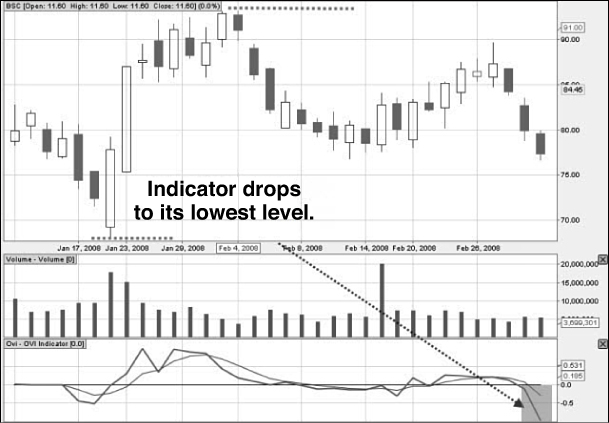
From January 1, 2008, until February 28, 2008, Bear Stearns (BSC) shares traded in a range between $68.18 and $93.09.
On March 3, 2008, Bear Stearns closed at $77.32 (see Chart 12.1). Around this time, many commentators suggested that BSC could be an aggressive takeover target and were therefore bullish on the stock.
Chart 12.1 • BSC March 3, 2008.
Source: OVI Charts. Courtesy of FlagTrader.com. Go to ...
Get Options Made Easy: Your Guide to Profitable Trading, Third Edition now with the O’Reilly learning platform.
O’Reilly members experience books, live events, courses curated by job role, and more from O’Reilly and nearly 200 top publishers.

