LIES, DAMNED LIES, AND STATISTICS
The middle circles shown in Figure 6-24 are the same size, although they definitely don't seem so. I know it for sure because I drew them myself; they are both 80 pixels in diameter. But “80 pixels” might not mean anything to you. It's just a number. We can only make sense of this number in comparison.
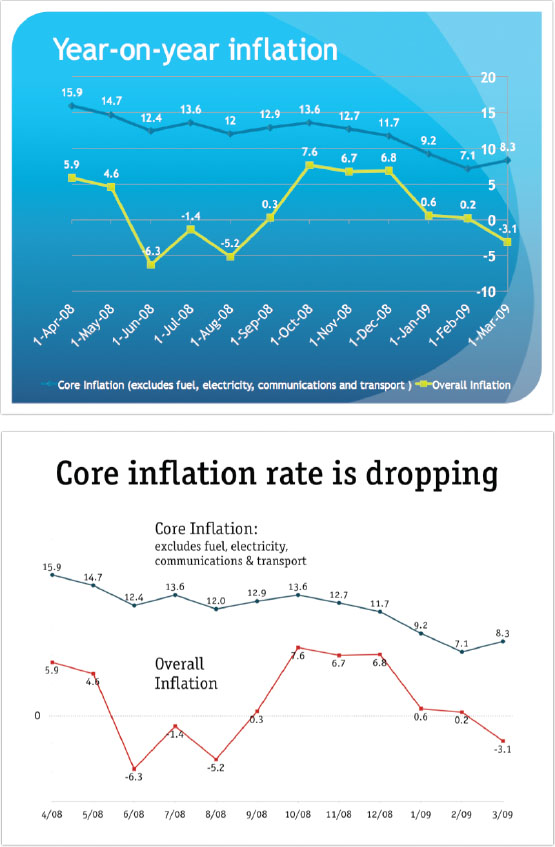
FIGURE 6-21: Line chart makeover.
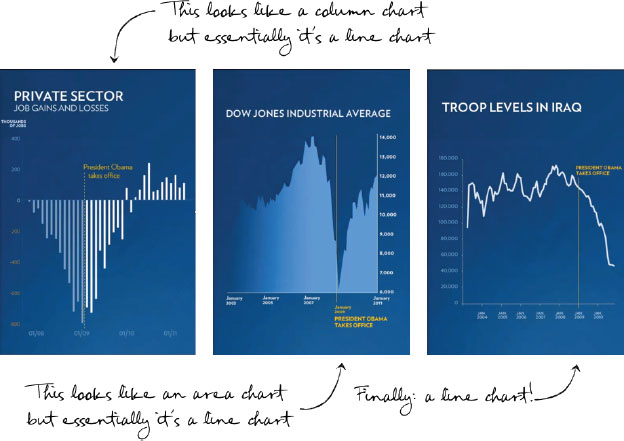
FIGURE 6-22: Obama's line charts.
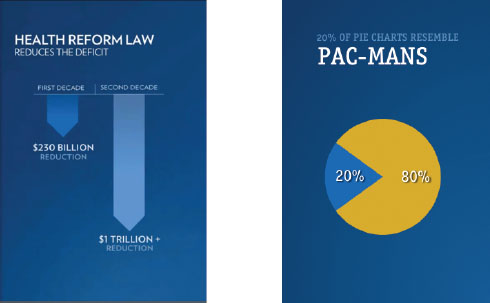
FIGURE 6-23: What does your chart resemble?
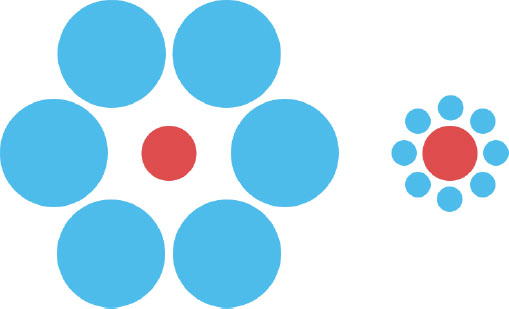
FIGURE 6-24: An optical illusion of size.
If you're surrounded by giants, you will seem small. If you're surrounded by pygmies, you will seem tall. We can try to be “objective” and not surround ourselves with anything or anybody, but then people have a hard time coming to any judgment at all. We can surround ourselves with giants, pygmies, and tons of average-sized people, but then we run into the risk of overloading the audience. So, where's the fine line?
![]() I don't exactly know where to draw the line, so I will just repeat my advice from
I don't exactly know where to draw the line, so I will just repeat my advice from
Get Presentation Secrets: Do What you Never Thought Possible With Your Presentations now with the O’Reilly learning platform.
O’Reilly members experience books, live events, courses curated by job role, and more from O’Reilly and nearly 200 top publishers.

