9.2. Performance
Performance is usually the bane of any development effort. Things that you put together on a development server simply never seem to stand up to the pounding of real traffic. Once again, however, CodeIgniter comes to your aid with a set of profiling and benchmarking tools that allows you to see how your pages (and even sections of code) perform.
9.2.1. Profiling
If you're curious about performance of any page, you can turn on profiling and get a detailed report of what's happening. This is a useful thing to do before a site goes live.
To turn on profiling, open your Welcome controller in an editor, and make the following change to the constructor:
function Welcome(){
  parent::Controller();
  $this->output->enable_profiler(TRUE);
}
Now visit the home page and scroll down. You should see a table giving details on how your application performed. You'll see entries for controller load time, queries run, and other data. It should look something like Figure 9-1.
Figure 9.1. Figure 9-1
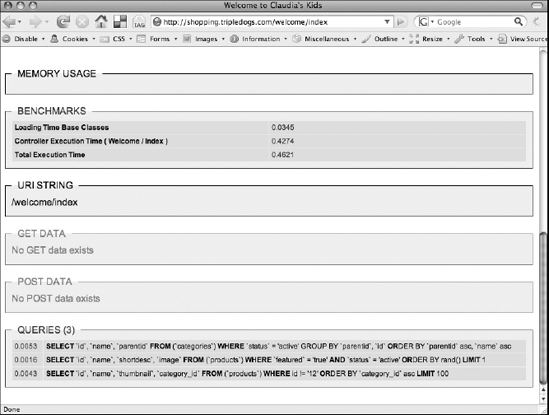
According to the example, the total execution time for the home page was about half a second. This is OK for a development server, but not acceptable for a real-life eCommerce site. It's time to start acting on this information to improve the situation.
9.2.1.1. Compressing Output
One obvious way to speed up your home page is to turn on output compression. Doing so enables Gzip output ...
Get Professional CodeIgniter® now with the O’Reilly learning platform.
O’Reilly members experience books, live events, courses curated by job role, and more from O’Reilly and nearly 200 top publishers.

