
Self-Service Analysis
WHAT’S IN THIS CHAPTER?
Using PivotTables and PivotCharts
Looking at the PowerPivot field list
Understanding the new PowerPivot data model
Using automatic relationship detection
Using metadata refresh
Using slicers
Understanding DAX measures
Taking advantage of other Excel features
Adding analysis to the SDR Healthcare Audit application
Up until now, you have seen how to assemble and enrich your self-service BI data using
PowerPivot. This has all been preparation for what you will see in this chapter — using Excel
to do self-service BI analysis. In the Microsoft BI world, and outside of Microsoft as well,
Microsoft Excel is the BI analysis tool of choice. PowerPivot is an acknowledgment and accep-
tance of that fact. This chapter shows how to take your PowerPivot data and use Excel to ana-
lyze that data.
PIVOTTABLES AND PIVOTCHARTS
Two features that make Excel an ideal BI client tool are PivotTables and PivotCharts. These
features allow you to analyze large quantities of data quickly and easily. This discussion won’t
go into much detail about how PivotTables and PivotCharts work (entire books have been
5
587379c05.indd 113 5/11/10 1:17:07 PM

114
CHAPTER 5 Self-Service AnAlySiS
written on the subject) but will instead focus on how PivotTables and PivotCharts work in the con-
text of PowerPivot workbooks.
For a good look at several books on PivotTables and PivotCharts, see
http://www.amazon.com/s/ref=nb_sb_noss?url=search-alias%3D
stripbooks&field-keywords=Excel+PivotTables+and+PivotCharts
.
PowerPivot provides commands that allow you to insert various combinations of PivotTables and
PivotCharts into a workbook. These commands can be invoked from the PowerPivot Window
(Figure 5-1) or from the PowerPivot tab in the Excel ribbon (Figure 5-2).
FIGURE 51: PivotTables and PivotCharts in the PowerPivot Window
FIGURE 52: PivotTables and PivotCharts in the PowerPivot tab of the
Excel ribbon
587379c05.indd 114 5/11/10 1:17:07 PM

PivotTables and PivotCharts
115
The selections on this menu are the ticket to creating PivotTables and PivotCharts using
PowerPivot data. They provide a convenient way to insert a single PivotTable, a single
PivotChart, or a combination of PivotTables and PivotCharts into a worksheet.
One reason for having these combinations is convenience — for example, if you know you will
want to have four charts on your worksheet, you can insert them all with a single command.
There is another reason you will want to choose one of the multi-PivotTable/PivotChart com-
mands over adding them one by one to your workbook that will be discussed in the “Slicers”
section later in this chapter. The following sections discuss different PivotTable/PivotChart
configurations.
Single PivotTable
This is the most basic configuration. A single PivotTable will be created. Figure 5-3 shows a
new PowerPivot PivotTable without any fields added. Note that, for PowerPivot PivotTables
(and PivotCharts), the PowerPivot field list is shown, rather than the normal Excel field list. The
PowerPivot field list will be described later in this chapter.
FIGURE 53: An empty PowerPivot PivotTable in Excel
587379c05.indd 115 5/11/10 1:17:07 PM
116
CHAPTER 5 Self-Service AnAlySiS
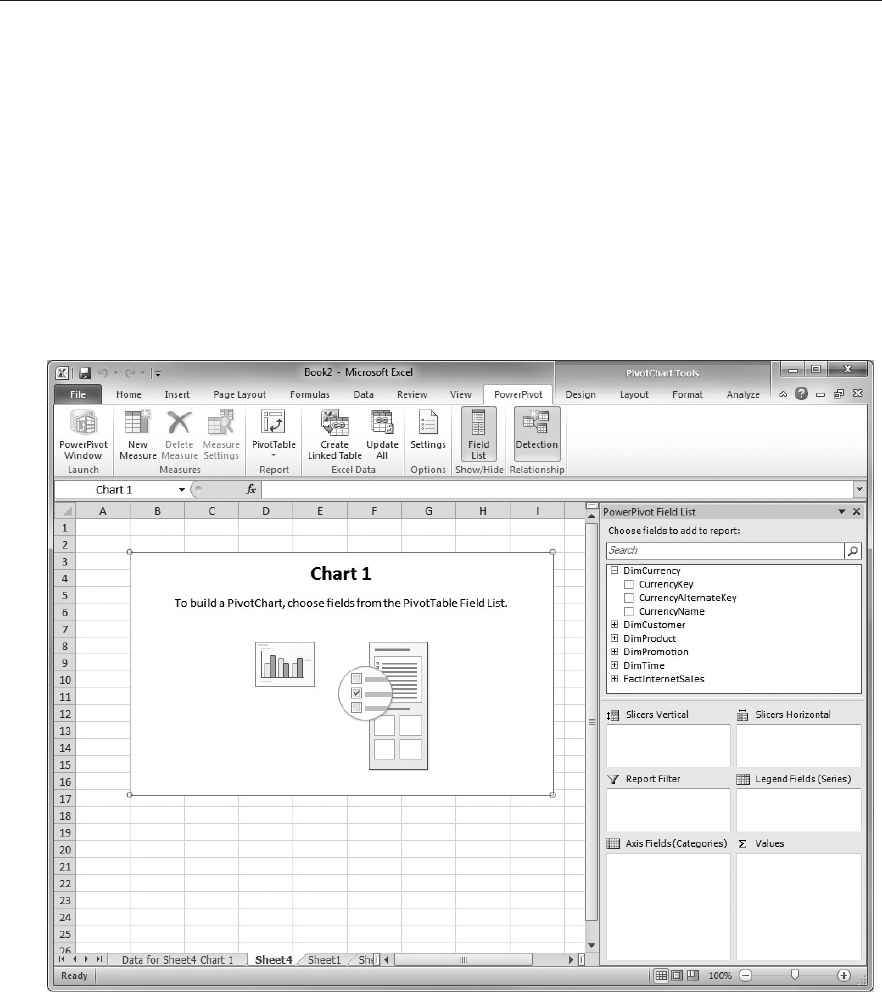
Single PivotChart
This configuration creates a single PivotChart. Note that PowerPivot will also create a PivotTable
on a separate sheet that contains the data the PivotChart will use. The sheet that is created for the
backing PivotTable will be named “Data for Sheet<x> Chart<y>.” This naming scheme can help
you navigate from the backing PivotTable back to the PivotChart, as long as you don’t rename the
PivotChart’s sheet or move the PivotChart to a different sheet.
There usually won’t be a need to refer to the backing PivotTable and you may want to hide that sheet
to lessen the number of visible worksheets in the workbook. PowerPivot doesn’t do this automati-
cally in order to make you aware that there is a PivotTable behind the PivotChart. Figure 5-4 shows
a new PowerPivot PivotChart. Note the tab for the backing PivotTable, “Data for Sheet4 Chart 1.”
FIGURE 54: An empty PowerPivot PivotChart in Excel
The following five configurations will create various combinations of PivotTables and/or
PivotCharts:
PivotChart and PivotTable Horizontal
PivotChart and PivotTable Vertical
587379c05.indd 116 5/11/10 1:17:07 PM
PivotTables and PivotCharts
117
Two PivotCharts Horizontal
Two PivotCharts Vertical
Four PivotCharts
Note that for each PivotChart created, there will be a backing PivotTable cre-
ated on a separate sheet.
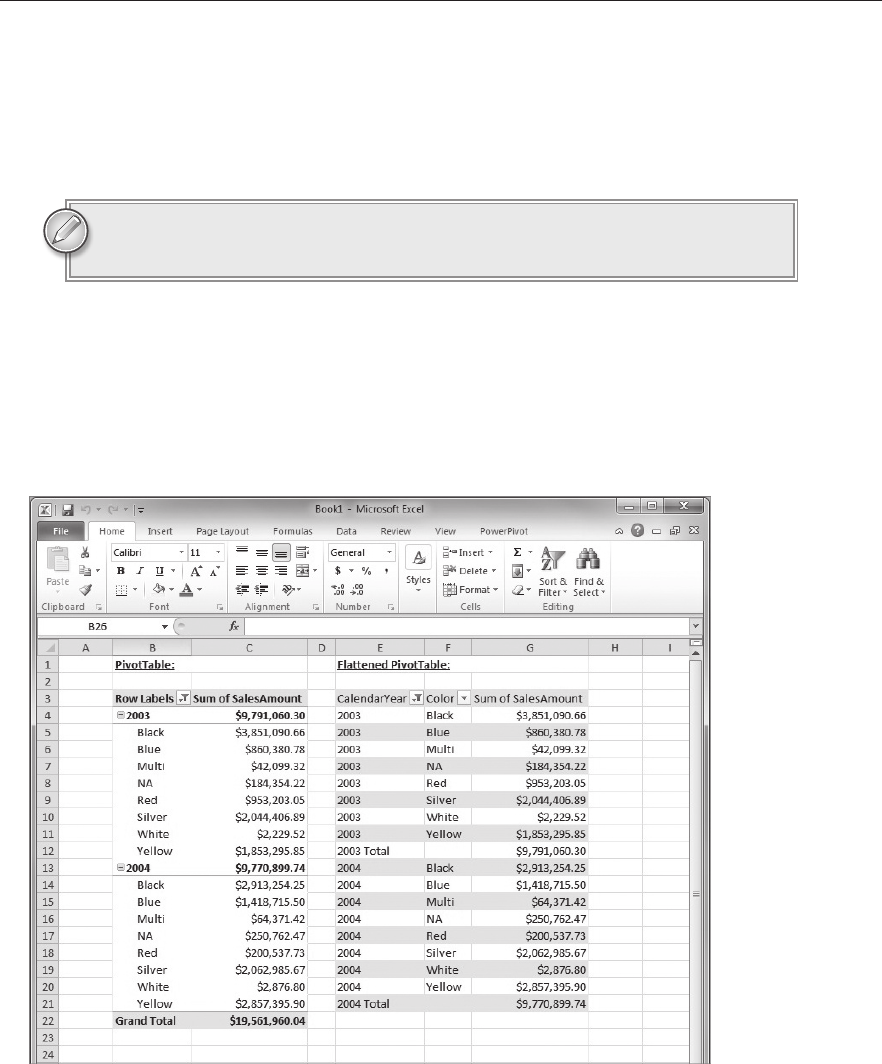
Flattened PivotTable
This configuration will create a Flattened PivotTable. When PowerPivot creates a Flattened
PivotTable, it will set some PivotTable properties that will show the PivotTable in a more printer-
friendly way. Figure 5-5 shows a side-by-side comparison between a PivotTable and a Flattened
PivotTable.
FIGURE 55: Regular and Flattened PivotTables
587379c05.indd 117 5/11/10 1:17:08 PM
Get Professional Microsoft® PowerPivot for Excel® and SharePoint® now with the O’Reilly learning platform.
O’Reilly members experience books, live events, courses curated by job role, and more from O’Reilly and nearly 200 top publishers.

