Debugging
Tracing provides you with a snapshot of the steps your code has taken after the code has run. At times, however, you’d like to monitor your code while it is running. What you want is more of a CAT scan than an autopsy. The code equivalent of a CAT scan is a symbolic debugger.
When you run your code in the debugger, you can watch your code work, step by step. As you walk through the code, you can see the variables change values, and you can watch as objects are created and destroyed.
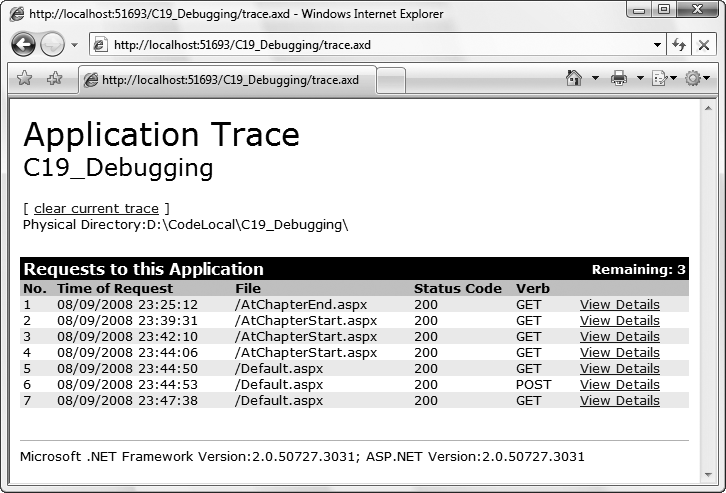
Figure 19-5. The ASP.NET trace viewer
This section will provide a brief introduction to the most important parts of the debugger that accompanies the VS2008 integrated development environment (IDE). For complete coverage of how to use the debugger, we urge you to spend time with the documentation and to experiment freely. The debugger is one of the most powerful tools at your disposal for learning ASP.NET.
Tip
There are some fantastic debugging blogs out there with some large, deep examples of exactly how far you can go into the rabbit hole of debugging. Check out these two for starters:
Tess Ferrandez at http://blogs.msdn.com/tess/
Mike Stall at http://blogs.msdn.com/jmstall/
You can configure an application to either enable or disable debugging. As with tracing, you do this in web.config. Often, you’ll enable debugging when the site is first run in VS2008, and it displays a prompt asking whether the ...
Get Programming ASP.NET 3.5, 4th Edition now with the O’Reilly learning platform.
O’Reilly members experience books, live events, courses curated by job role, and more from O’Reilly and nearly 200 top publishers.

