To plot geographic data using the sp package, follow these steps:
- Load the sp and rgdal packages:
> library(sp)
> library(rgdal)
- Read the data:
> countries_sp <- readOGR(".", "ne_50m_admin_0_countries")
> airports_sp <- readOGR(".", "ne_50m_airports")
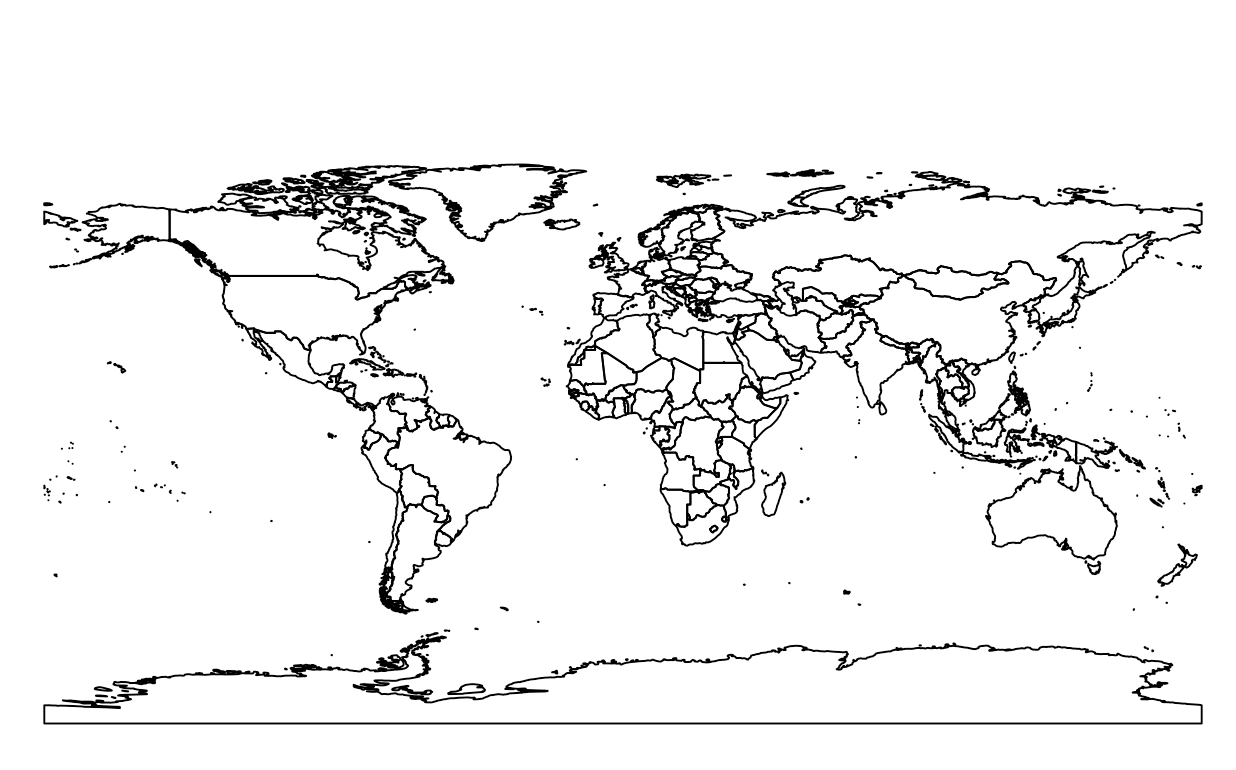
- Plot the countries without color:
> # without color
> plot(countries_sp)
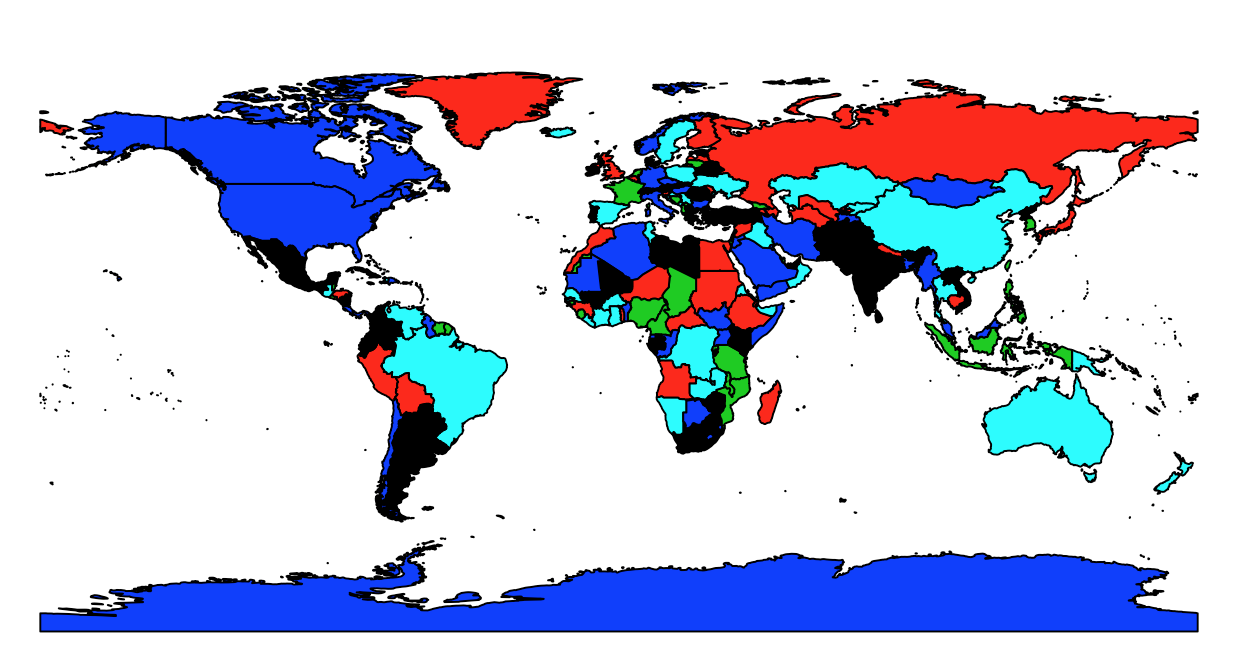
- Plot the countries with color:
> # with color
> plot(countries_sp, col = countries_sp@data$admin)
- Add the airports. Do not close the previous plot:
> plot(airports_sp, add=TRUE)
- Plot the economic ...

