Chapter 7. Annotations
Displaying just your data usually isn’t enough—there’s all sorts of other information that can help the viewer interpret the data. In addition to the standard repertoire of axis labels, tick marks, and legends, you can also add individual graphical or text elements to your plot. These can be used to add extra contextual information, highlight an area of the plot, or add some descriptive text about the data.
Adding Text Annotations
Problem
You want to add a text annotation to a plot.
Solution
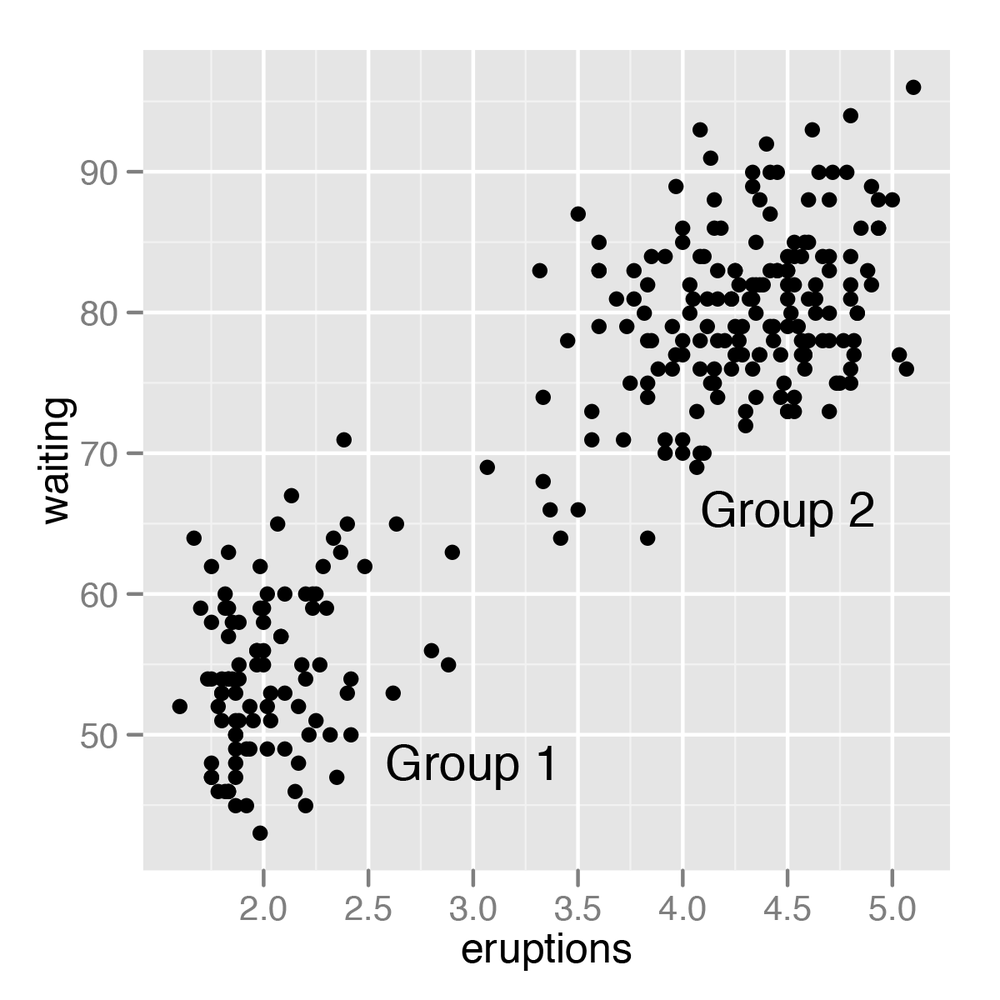
Use annotate() and a text geom (Figure 7-1):
p<-ggplot(faithful,aes(x=eruptions,y=waiting))+geom_point()p+annotate("text",x=3,y=48,label="Group 1")+annotate("text",x=4.5,y=66,label="Group 2")
Discussion
The annotate() function can
be used to add any type of geometric object. In this case, we used
geom="text".
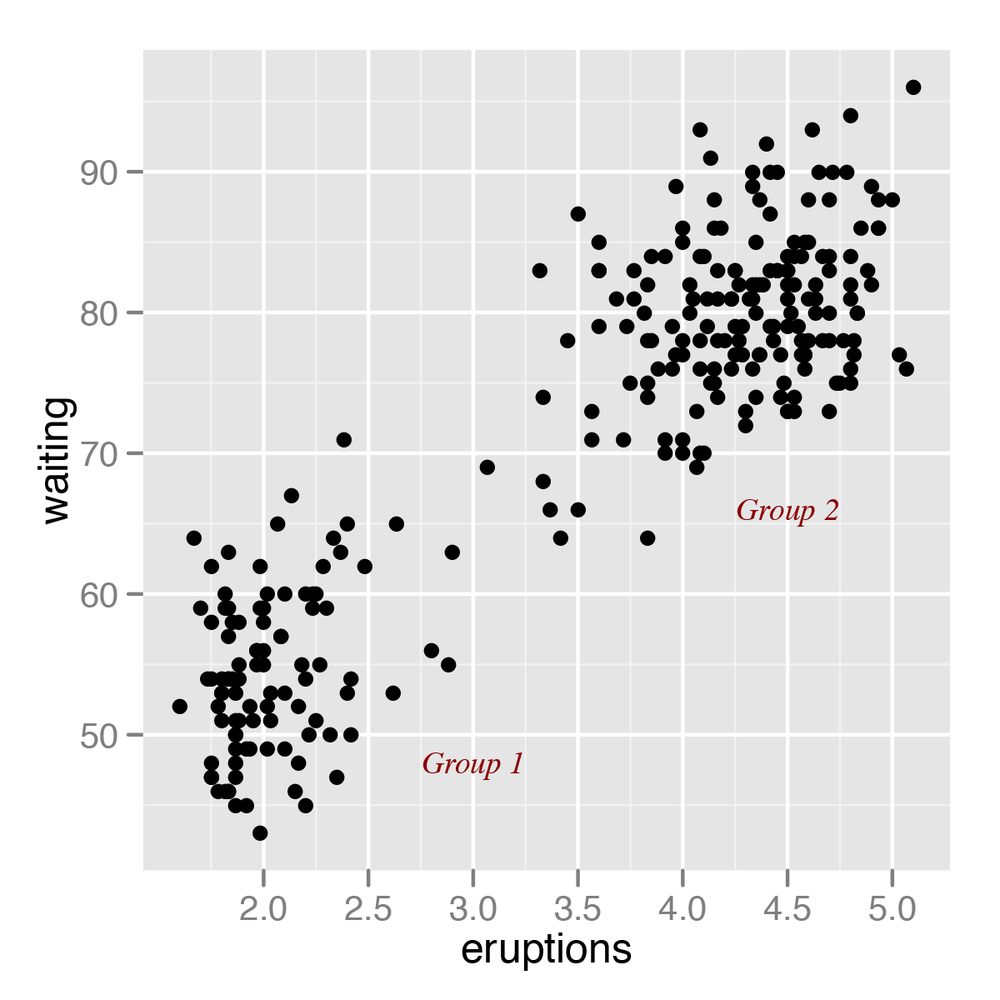
Other text properties can be specified, as shown in Figure 7-2:
p+annotate("text",x=3,y=48,label="Group 1",family="serif",fontface="italic",colour="darkred",size=3)+annotate("text",x=4.5,y=66,label="Group 2",family="serif",fontface="italic",colour="darkred",size=3)
Be careful not to use geom_text() when you want to add individual
text objects. While annotate(geom="text") will add a ...
Get R Graphics Cookbook now with the O’Reilly learning platform.
O’Reilly members experience books, live events, courses curated by job role, and more from O’Reilly and nearly 200 top publishers.

