Chapter 1. Introduction to RUM
Man is the measure of all things.
Protagoras
What are “Real User Measurements” or RUM? Simply put, RUM is measurements from end users. On the web, RUM metrics are generated from a page or an app that is being served to an actual user on the Internet. It is really just that. There are many things you can measure. One very common measure is how a site is performing from the perspective of different geolocations and subnet’s of the Internet. You can also measure how some server on the Internet is performing. You can measure how many people watch a certain video. Or you can measure the Round Trip Time (RTT) to Amazon Web Services (AWS) East versus AWS Oregon from wherever your page is being served. You can even measure the temperature of your mother’s chicken-noodle soup (if you have a thermometer stuck in a bowl of the stuff and it is hooked to the Internet with an appropriate API). Anything that can be measured can be measured via RUM. We will discuss this in more detail later.
In this book, we will attempt to do three things at once (a sometimes risky strategy):
-
Discuss RUM Broadly, not just web-related RUM, but real user measurements from a few different perspectives, as well. This will provide context and hopefully some entertaining diversion from what can be a dry topic otherwise.
-
Provide a reasonable overview of how RUM is being used on the Web today.
-
Discuss in some detail the use cases where the last mile is important—and what the complexities can be for those use cases.
Many pundits have conflated RUM with something specifically to do with monitoring user interaction or website performance. Although this is certainly one of the most prevalent uses, it is not the essence of RUM. Rather, it is the thing being measured. RUM is the source of the measurements—not the target. By this I mean that RUM refers to where the measurements come from, not what is being measured. RUM is user initiated. This book will explore RUM’s essence more than the targets. Of course, we will touch on the targets of RUM, whether they be Page Load Times (PLT), or latency to public Internet infrastructure, or Nielson Ratings.
RUM is most often contrasted to synthetic measurements. Synthetic measurements are measurements that are not generated from a real end user; rather, they are generated typically on a timed basis from a data center or some other fixed location. Synthetic measurements are computer generated. These types of measurements can also measure a wide variety of things such as the wind and wave conditions 50 miles off the coast of the outer banks of North Carolina. On the web, they are most often associated with Application Performance Monitoring (APM) tools that measure such things as processor utilization, Network Interface Card (NIC) congestion, and available memory—server health, generally speaking. But again, this is the target of the measurement, not its source. Synthetic measurements can generally be used to measure anything.
Active versus Passive Monitor
Another distinction worth mentioning here is between Passive and Active measurements. A passive measurement is a measurement that is taken from input into the site or app. It is passive because there is no action being taken to create the monitoring event; rather, it comes in and is just recorded. It has been described as an observational study of the traffic already on your site or network. Sometimes, Passive Monitoring is captured by a specialized device on the network that can, for instance, capture network packets for analysis. It can also be achieved with some of the built-in capabilities on switches, load-balancers or other network devices.
An active measurement is a controlled experiment. There are near infinite experiments that can be made, but a good example might be to detect the latency between your data center and your users, or to generate some test traffic on a network and monitor how that affects a video stream running over that network.
Generally speaking:
-
The essence of RUM is that it is user initiated.
-
The essence of Synthetic is that it is computer generated.
-
The essence of Passive Monitoring is that it is an observational study of what is actually happening based on existing traffic.
-
The essence of Active Monitoring is that it is a controlled experiment.
More broadly, when you are thinking about these types of measurements, you can break them down in the following way:
-
RUM/Active Monitoring makes it possible to test conditions that could lead to problems—before they happen—by running controlled experiments initiated by a real user.
-
With RUM/Passive Monitoring, you can detect problems in real time by showing what is actually happening on your site or your mobile app.
-
Synthetic/Active Monitoring accommodates regular systematic testing of something using an active outbound monitor.
-
Using Synthetic/Passive Monitoring, you can implement regular systematic testing of something using some human/environmental element as the trigger.
It’s also useful to understand that generally, although Synthetic Monitoring typically has fewer measurements, RUM typically has lots of measurements. Lots. We will get into this more later.
RUM is sometimes conflated with “Passive” measurements. You can see why. However this is not exactly correct. A RUM measurement can be either active or passive.
| RUM (user initiated) | Synthetic (computer initiated) | |
|---|---|---|
| Active (generates traffic) | A real user’s activity causes an active probe to be sent. Real user traffic generating a controlled experiment. Typified by companies like web-based Cedexis, NS1, SOASTA (in certain cases), and web load testing company Mercury (now HP). | Controlled experiment generated from a device typically sitting on multiple network points of presence. Typified by companies like Catchpoint, 1000 Eyes, New Relic, Rigor, Keynote, and Gomez. Internap’s Managed Internet Route Optimization (MIRO) or Noction’s IRP. |
| Passive (does not generate traffic) | Real user traffic is logged and tracked, including performance and other factors. Observational study used in usability studies, performance studies, malicious probe analysis and many other uses. Typified by companies like Pingdom, SOASTA, Cedexis, and New Relic that use this data to monitor website performance. | Observational study of probes sent out from fixed locations at fixed intervals. For instance, Traffic testing tools that ingest and process these synthetic probes. A real-world example would be NOAA’s weather sensors in the ocean—used for detection of large weather events such as a Tsunami. |
We will discuss this in much greater detail in Chapter 4. For now let’s just briefly state that on the Internet, RUM is typically deployed in one of the following ways:
-
Some type of “tag” on the web page. The “tag" is often a snippet of JavaScript.
-
Some type of passive network monitor. Sometimes described as a packet sniffer.
-
Some type of monitor on a load balancer.
-
A passive monitor on the web server itself
In this document, we will most often be referring to tags, as mentioned earlier. However, we will discuss the other three in passing (mostly in Chapter 4).
It is instrumental to understand the flow of RUM versus Synthetic Monitoring. Figure 1-1 shows you what the typical synthetic flow looks like.
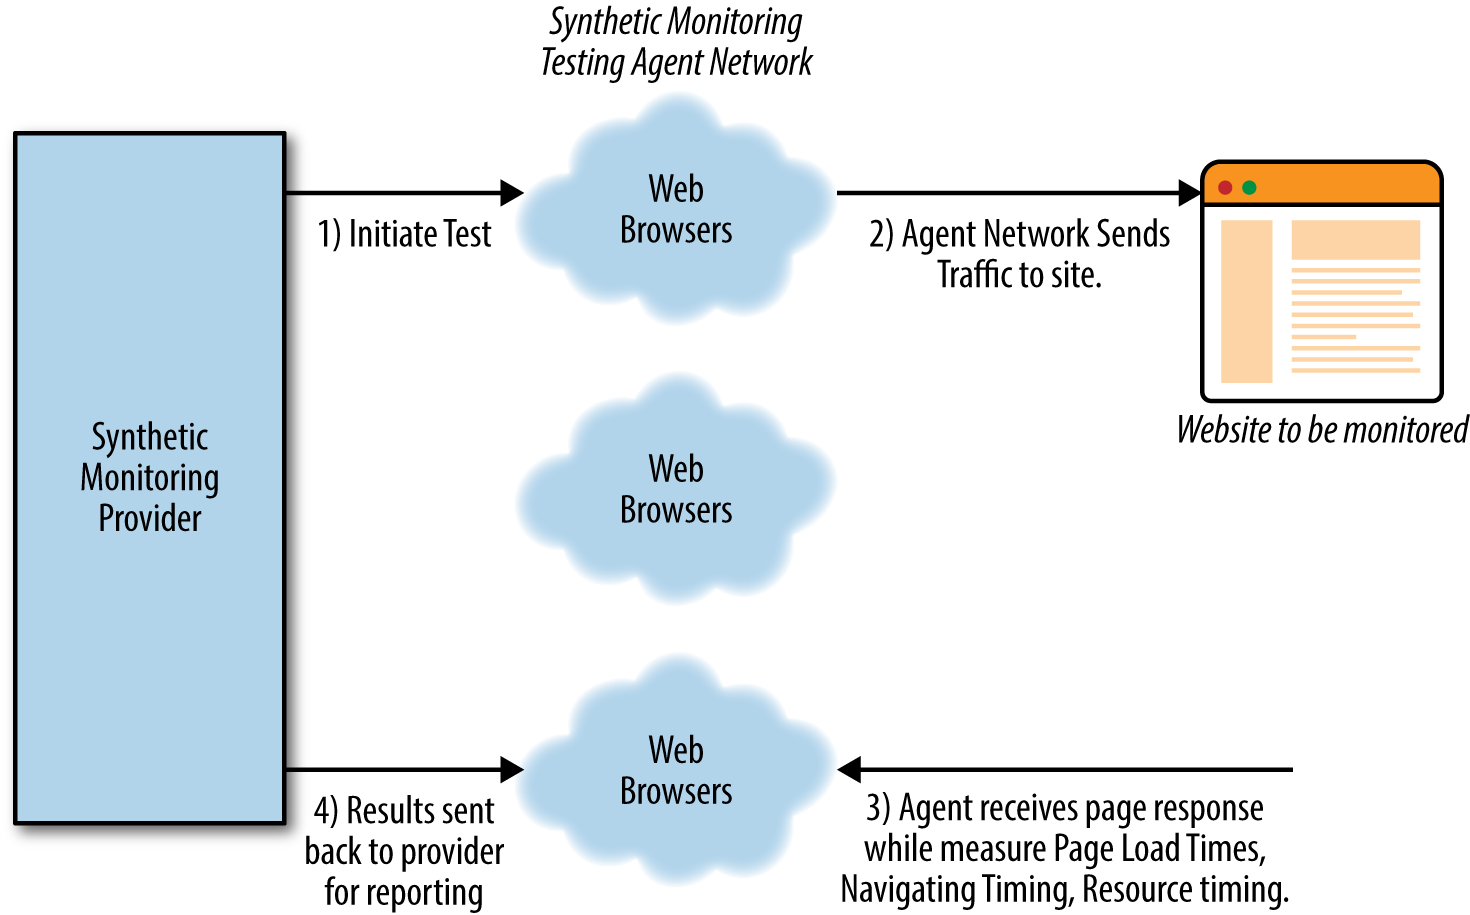
Figure 1-1. Typical flow of a Synthetic Monitor
As you can see, it’s a simple process of requesting a set of measurements to be run from a network of test agents that live in data centers or clouds around the globe.
With a RUM measurement of a website, the flow is quite different, as demonstrated in Figure 1-2.
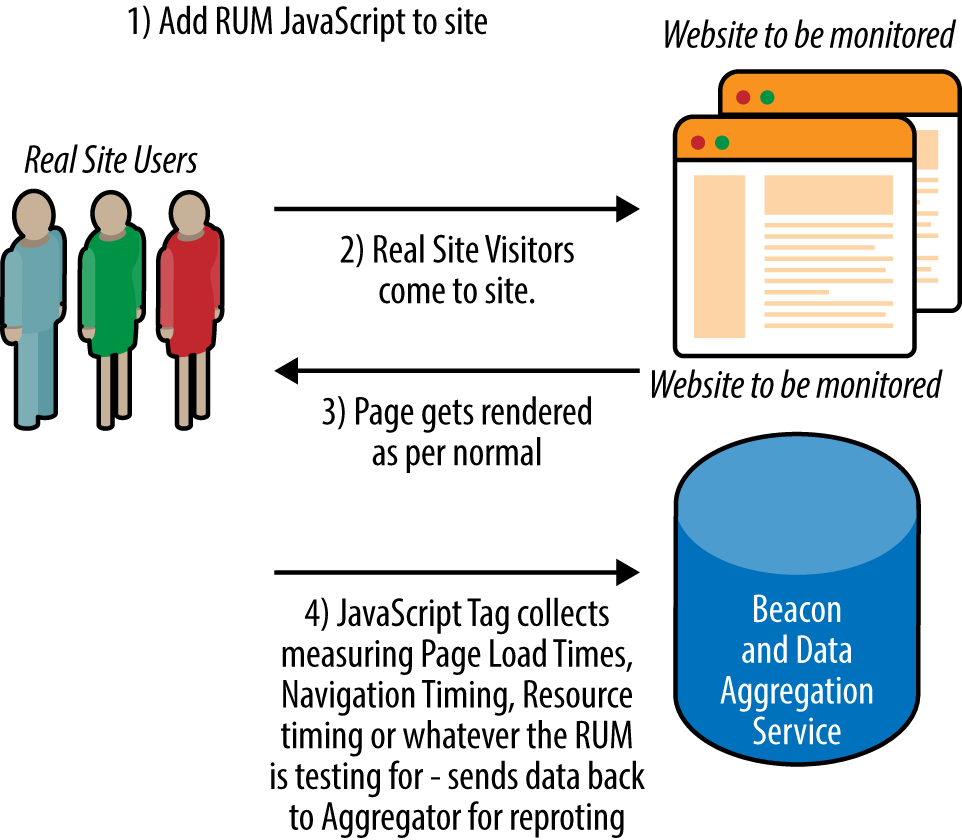
Figure 1-2. Typical flow of a RUM
In what follows, we will discuss the pros and cons of RUM, quantitative thresholds of RUM, aggregating community measurements, ingesting RUM measurements (there are typically a LOT of them), and general reporting. Toward the end, I will give some interesting examples of RUM usage.
The Last Mile
Finally in this introduction, I want to bring up the concept of the last mile. The last mile refers to the Internet Service Provider (ISP) or network that provides the connectivity to the end user. The term the “last mile” is sometimes used to refer to the delivery of the goods in ecommerce context, but here we use it in the sense of the last mile of fiber, copper, wireless, satellite, or coaxial cable that connects the end user to the Internet.
Figure 1-3 presents this graphically. The networks represent last-mile onramps to the Internet as well as middle mile providers. There are more than 50,000 networks that make up the Internet. Some of them are end-user net‐works (or eyeball networks) and many of them are middle mile and Tier 1 networks that specialize in long haul. How they are connected to one another is one of the most important things you should understand about the Internet. These are called peering relationships, and they can be paid or unpaid depending on the relationship between the two companies. (We go into more detail about this in Chapter 2.) The number of networks crossed to get to a destination is referred to as hops. These hops are the basic building blocks that Border Gateway Protocol (BGP) uses to select paths through the Internet. As you can see in Figure 1-3, if a user were trying to get to the upper cloud instance from the ISP in the upper left, it would entail four hops, whereas the getting there from the ISP in lower left would only make three hops. But that does not mean that the lower ISP has a faster route. Because of outages between networks, lack of deployed capacity or congestion, the users of the lower ISP might actually find it faster to traverse the eight-hop path to get to the upper cloud because latency is lower via that route.
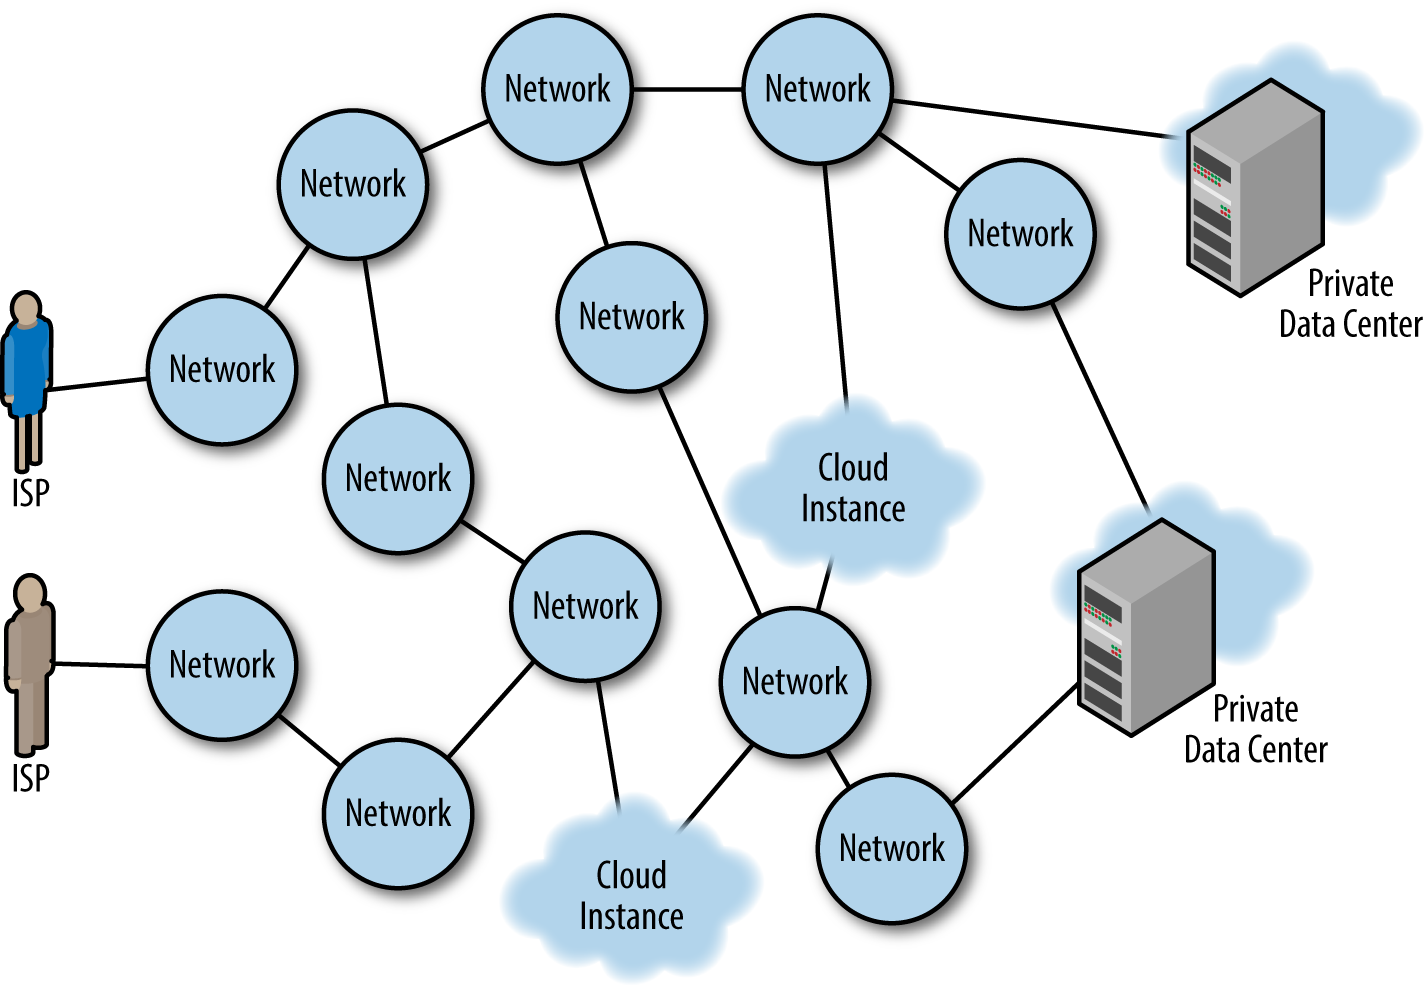
Figure 1-3. ISPs, middle-mile networks: the 50,000-plus subnets of the Internet
Why is the last mile important? Because it is precisely these ISPs and networks that are often the best places to look to improve performance, not always by just increasing bandwidth from that provider, but through intelligent routing. It’s also important because it’s where the users are—and if you run a website you probably care about where your users are coming from. Of course, in this sense, it’s not just what geographies they come from; it’s also what ISPs they come from. This information is crucial to be able to scale your service successfully. It’s also where your users are actually experiencing your sites performance. You can simulate this with synthetic measurements, but as we show in the chapters that follow, there are many problems with this type of simulation. The last mile is important for exactly these reasons.
References
- Tom Huston, “What Is Real User Monitoring?”
- Andrew McHugh, “Where RUM fits in.”
- Thanks to Dan Sullivan for the very useful distinction between observational study and controlled experiment (“Active vs Passive Network Monitoring”).
- Herbert Arthur Klein, The Science of Measurement: A Historical Survey, Dover Publishing (1974).
Get Real User Measurements now with the O’Reilly learning platform.
O’Reilly members experience books, live events, courses curated by job role, and more from O’Reilly and nearly 200 top publishers.

