Lesson 5Customizing Data in the Dashboard
In this lesson, you learn how to customize the data displayed in the Dashboard’s overview graph.
Displaying Different Metrics
The overview graph in the Google Analytics Dashboard is a useful tool for viewing essential information about your site’s performance. It’s also a versatile tool; although it displays visits per day by default, as shown in Figure 5.1, it can also graph other important metrics in a number of different ways.
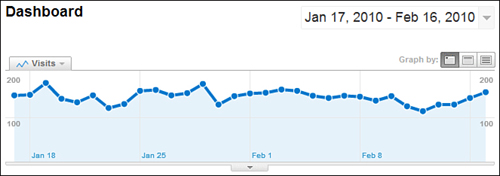
FIGURE 5.1 The overview graph on the Google Analytics Dashboard.
You can display the following metrics in the overview graph:
• Visits (default)
• Pageviews
• Pages/Visit
• Average ...
Get Sams Teach Yourself Google Analytics™ in 10 Minutes now with the O’Reilly learning platform.
O’Reilly members experience books, live events, courses curated by job role, and more from O’Reilly and nearly 200 top publishers.

