P1: PIC/b P2: c/d QC: e/f T1: g
c07 JWBK195-Saettele June 5, 2008 19:52 Printer: Yet to come
Explanation of Elliott Wave and Fibonacci 175
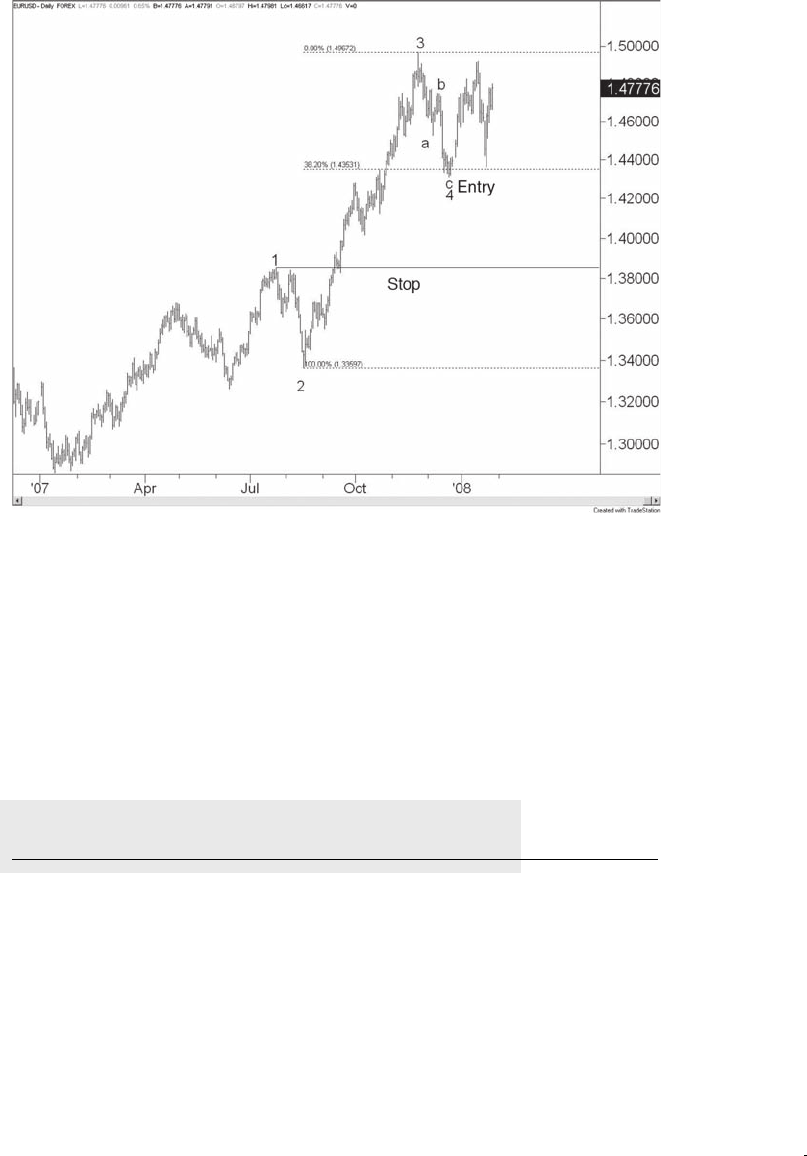
FIGURE 7.25 Wave 4 into Wave 5
Source: Chart created on TradeStation
R
, the flagship product of TradeStation Tech-
nologies, Inc.
correction (wave C), you do not know whether the pattern will resolve as
a flat or a triangle. For this reason, it is important to keep risk tight when
trading wave C of a flat. The example in Figure 7.26 of the EURJPY shows
that wave B retraced nearly 100 percent of wave A before wave C began.
SOME DIFFERENCES BETWEEN STOCKS
AND FX IN ELLIOTT
The path of the stock market represents human progress and regress, con-
struction and destruction, growth and decay. The stock market is always
in one of the five waves at the largest degree of trend. Degrees of trend are
not covered in this book in detail, but an introduction is in order. As de-
scribed in Elliott Wave Principle, “All waves may be categorized by relative
size, or degree. The degree of a wave is determined by its size and position


