Chapter 5. Channel Patterns, Cycles, and Price Breaks
When a channel pattern appears in price data, it merits serious attention. Channel patterns show a persistence of sentiment in a unique way. Traders will notice that prices change within a channel. We can see in Figure 5.1 that the price repeats a regular pattern of swings from high to low and low to high. We can therefore understand that channel patterns are really a form of cycles. This means that traders, when observing a channel pattern, should try to confirm whether there is a cycle embedded in the pattern. Let's explore some further concepts underlying cycles. We will explore cycles with more depth in Chapter 13.
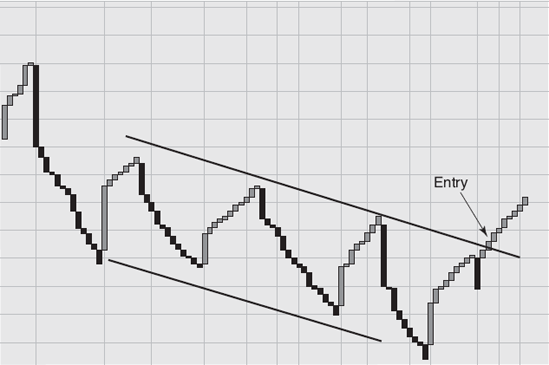
Figure 5.1. Channel Pattern in Six-Line Price Break Chart.: Source: Abe Cofnas and Joseph Egbulefu
Note
As we know, the economy does not develop steadily and directly. In fact, it rises in cycles, that is, with expansion and contraction, or prosperity and slack, by turns. ... In order to effectively monitor and early-warn the macro economy, the economic cycle should be carefully examined.[6]
Cycles exist and express themselves everywhere. The lunar cycle is the most famous cycle, and is an almost perfect example of a pattern that we can accurately project into the future. We cannot project financial and market data with the same accuracy as a lunar cycle. It is still valid to investigate whether a cycle exists in the ...
Get Sentiment Indicators - Renko, Price Break, Kagi, Point and Figure: What They Are and How to Use Them to Trade now with the O’Reilly learning platform.
O’Reilly members experience books, live events, courses curated by job role, and more from O’Reilly and nearly 200 top publishers.

