Adding a Chart
The fastest way to add a chart to your PowerPoint presentation is to apply a slide layout that contains a chart. To do so, click the New Slide button on the Formatting toolbar and then choose an appropriate layout from the Slide Layout task pane. The next step varies depending on the slide layout you choose.
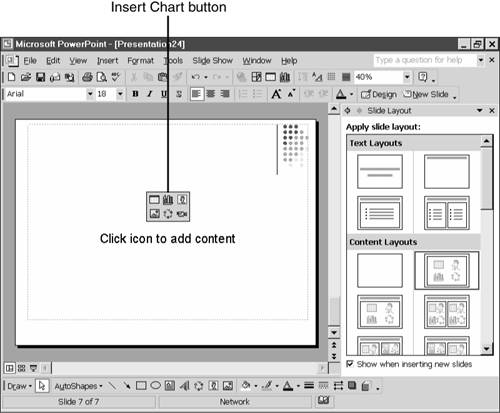
If you choose any of the layouts in the Content Layouts or Text and Content Layouts sections, you need to click the Insert Chart button on the content palette that displays (see Figure 11.2) to activate the chart and Microsoft Graph.
Figure 11.2. Click the Insert Chart button to start creating a chart.

If you choose one the ...
Get Special Edition Using Microsoft® PowerPoint® 2002 now with the O’Reilly learning platform.
O’Reilly members experience books, live events, courses curated by job role, and more from O’Reilly and nearly 200 top publishers.

