Static Real-Time dashboard
In this section, we will create a real-time dashboard that will display crucial information based on the data we have. To encourage you, we present a screenshot here with how it will look when we are done:
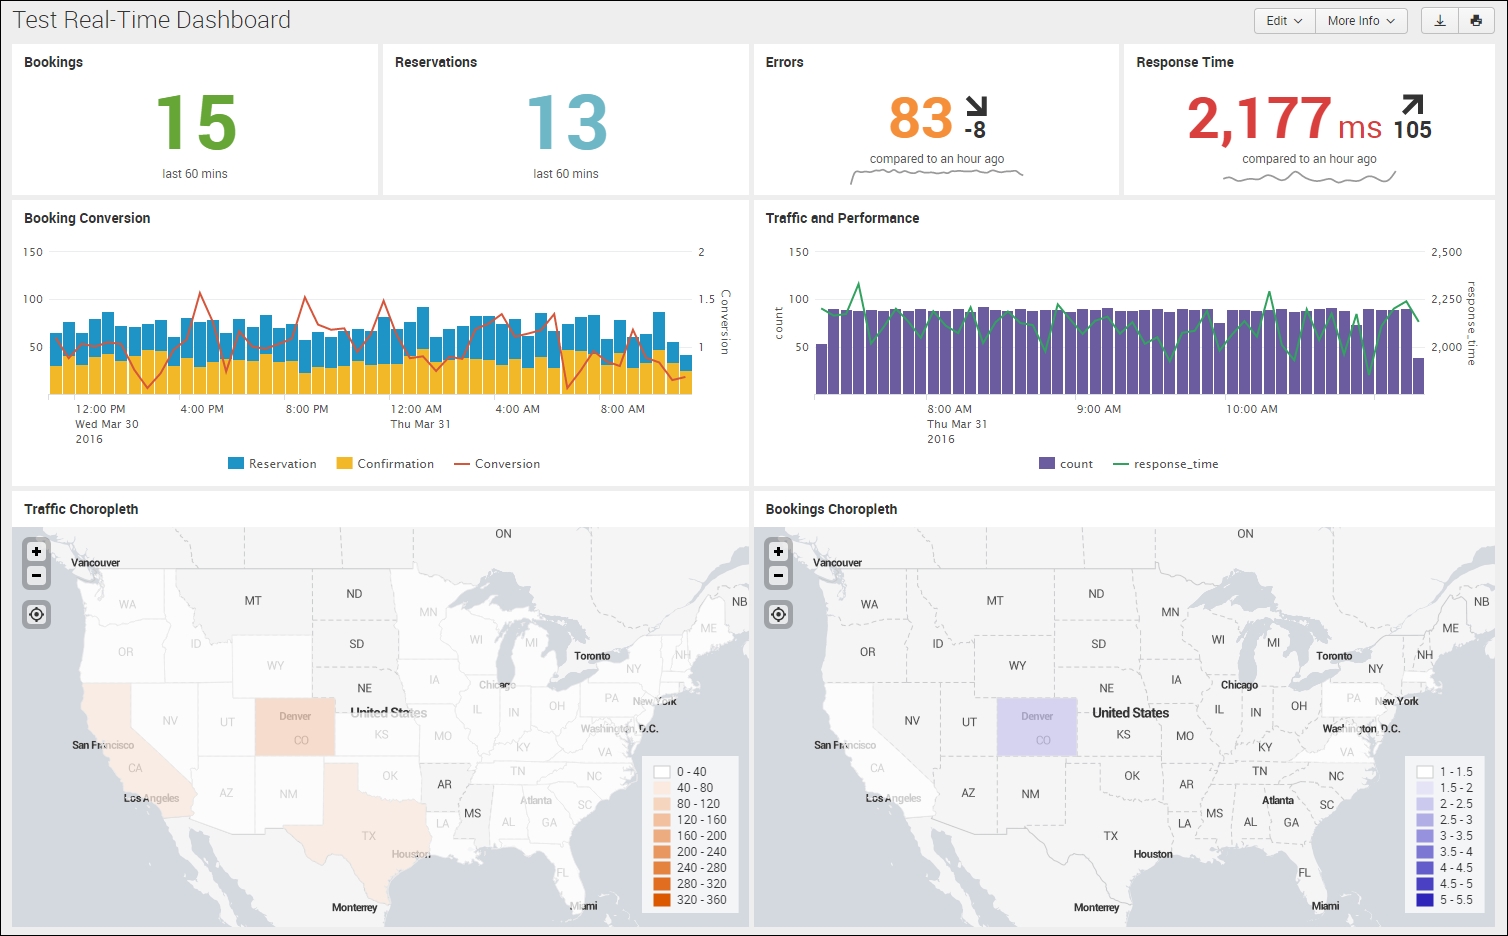
Test real-time dashboard with advanced indicators, combo charts, and choropleth charts
Single Value Panels with color ranges
In the previous sections, you first created panels by running a search then saving them in a dashboard. After you created all your search panels, you then started to modify the visualization from the dashboard. This is one way to achieve it. However, typically you first want to see your visualization ...
Get Splunk: Enterprise Operational Intelligence Delivered now with the O’Reilly learning platform.
O’Reilly members experience books, live events, courses curated by job role, and more from O’Reilly and nearly 200 top publishers.

