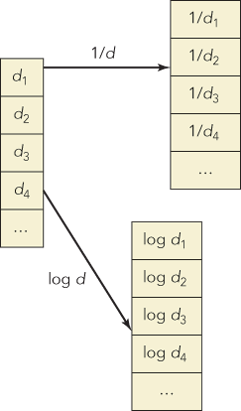
... in price are linearly associated with percentage changes in sales, then log transformations will be useful. (An example of this use of logs appears later in this chapter.) Other transformations such as squares may be needed to obtain a linear relationship.

The process of choosing an appropriate transformation is usually iterative: Try a transformation to see whether it makes the association more linear. Figure 20.5 (called Tukey’s bulging rule) suggests when to use logs, reciprocals, and squares to convert a bending pattern into a linear pattern. Simply match the pattern in your scatterplot of Y on X to one of the shapes in the figure.
For example, ...
Get Statistics for Business: Decision Making and Analysis, 3rd Edition now with the O’Reilly learning platform.
O’Reilly members experience books, live events, courses curated by job role, and more from O’Reilly and nearly 200 top publishers.

