Appendix 6.A Including covariate in the LTA model
In this appendix we use simulated data to demonstrate how covariate affects latent class membership and class membership transitions. Based on the example LTA model with two time points illustrated in Mplus Web Notes No. 13 (Muthén and Asparouhov, 2011a), in our example model we increase the number of latent classes from 2 to 3 in both latent classes c1 and c2, thus increasing the number of latent class transitions from 4 to 9. Using the Monte Carlo approach, data with 1000 cases were simulated for a LTA model with two 3-class latent variables c1 and c2, each of which has four dichotomous indicators. A continuous covariate x was generated in the data to influence c1 and c2 as well as the transitions from c1 to c2.
Including covariate x to predict latent classes in LTA model. If our interest is only to see how covariate x affects the latent class membership in the LTA model, this can be done simply by specifying regressions of latent classes c1 and c2 on x in the following Mplus program.
Mplus Program 6.12
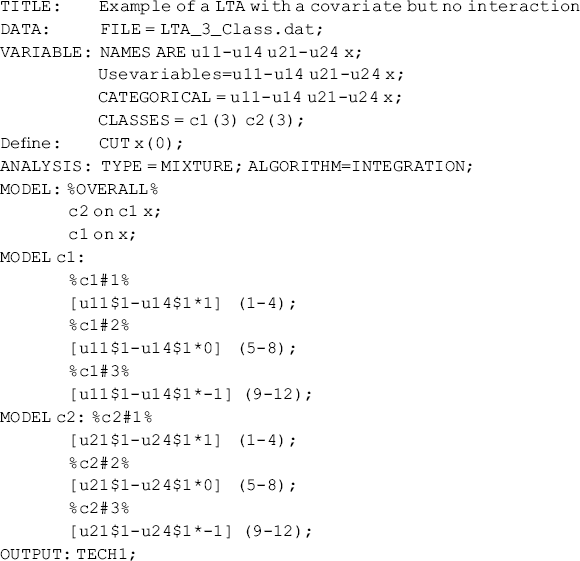
where data set LTA_3_Class.dat is the simulated data; variable x is recoded as a dummy variable (e.g., 1, intervention; 0, control) using the CUT option with a cut-off point of 0 in the DEFINE command. In the overall MODEL command, two multinomial logit models are specified: (1) regressing c2 on c1 and x; and (2) regressing c
Get Structural Equation Modeling: Applications Using Mplus now with the O’Reilly learning platform.
O’Reilly members experience books, live events, courses curated by job role, and more from O’Reilly and nearly 200 top publishers.

