CHAPTER 11
CHAPTER 11 SOLUTIONS
11.1 SECTION 11.2
11.1 When all information is available, the calculations are in Table 11.1. As in Example 11.4, values apply from the current y-value to the next one.
11.2 (a) ![]()
![]()
(b)![]()
11.3 ![]()
![]()
Table 11.1 Calculations for Exercise 11.1.
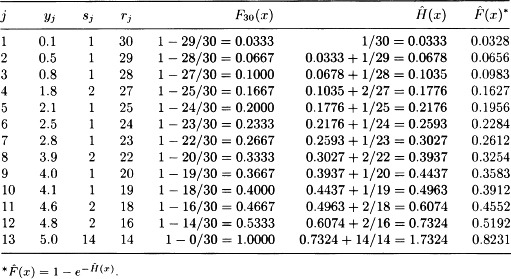
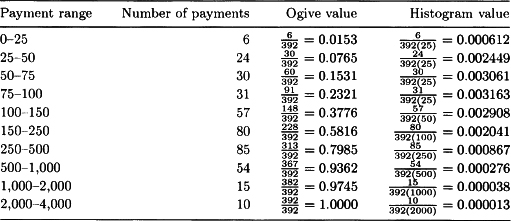
Table 11.2 Calculations for Exercise 11.4.
11.2 SECTION 11.3
11.4 There are 392 observations and the calculations are in Table 11.2. For each interval, the ogive value is for the right-hand endpoint of the interval, while the histogram value is for the entire interval. Graphs of the ogive and histogram appear in Figures 11.1 and 11.2.
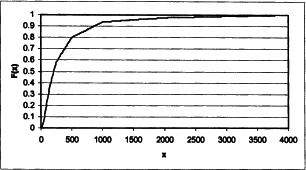
Figure 11.1 Ogive for Exercise 11.4.
Figure 11.2 Histogram for Exercise 11.4.
Get Student Solutions Manual to Accompany Loss Models: From Data to Decisions, Fourth Edition now with the O’Reilly learning platform.
O’Reilly members experience books, live events, courses curated by job role, and more from O’Reilly and nearly 200 top publishers.

