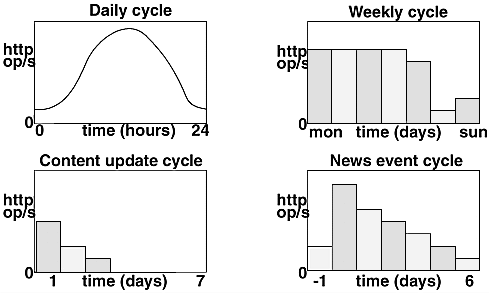
Real-World HTTP Rate Changes over Time
The graphs shown in Figure 4-14 are derived from observations at www.sun.com. They are typical of the load on a commercial internet site being used to provide marketing and product information. Other types of sites should construct their own versions of these graphs.
Figure 4-14. Workload Patterns

The first graph shows the load varying during the day. The load depends upon the audience, but for www.sun.com, it peaks during working hours for the western USA time zone. The eastern USA brings the level up earlier in the day, and Europe and Japan keep it going through the night. Other sites that serve users ...
Get Sun Performance and Tuning: Java™ and the Internet, Second Edition now with the O’Reilly learning platform.
O’Reilly members experience books, live events, courses curated by job role, and more from O’Reilly and nearly 200 top publishers.

