CHAPTER 11
Opening Range Breakout
The research and setup I describe in these pages goes by other names, depending on whom you ask. I call it the opening range breakout. In short, when price leaves a trading range, then trade with the trend. Let me show you an example, and then I will discuss the particulars.
Figure 11.1 shows an example of the opening range breakout. I used the first 20 minutes of trading in this example to highlight the high-low range. The range is the highest high (A) and lowest low (B) made by the stock in the first 20 minutes of trading.
FIGURE 11.1 The opening range breakout, with price clustered near the top of the range, leads to a good gain.
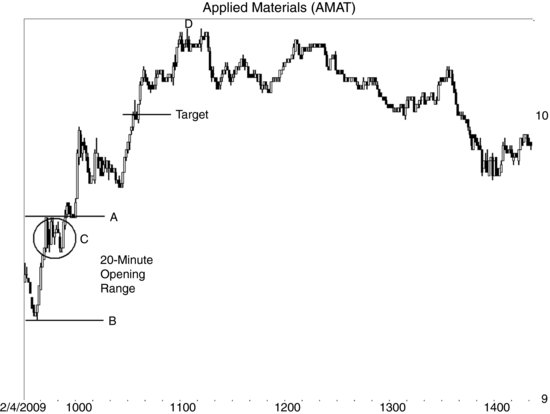
Notice that price hugs the top of the range (circled, at C) more than it does the bottom of the range. Research shows that such behavior leads to better gains. The reverse is also true. When price walks along the bottom of the range more than it does the top and then breaks out downward, the drop is larger than if price were to hug the top of the range and break out downward.
- For upward breakouts, look for price to hug the top of the range more than it does the bottom of the range. For downward breakouts, look for the reverse: Price should hug the bottom of the range most often.
I show a target based on the round number 10. Often in day trading, round numbers (those ending with a zero or double zero) represent support ...
Get Swing and Day Trading: Evolution of a Trader now with the O’Reilly learning platform.
O’Reilly members experience books, live events, courses curated by job role, and more from O’Reilly and nearly 200 top publishers.

