Using path to display movement in map
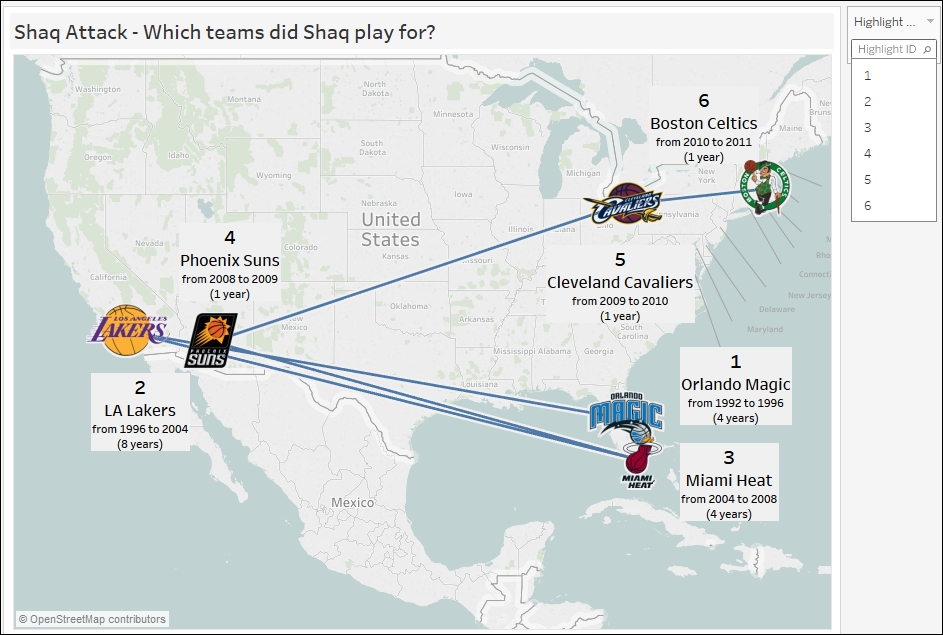
We can visualize movements in Tableau by drawing lines between points. This takes advantage of the Line mark and the Path property.
In this recipe, we are going to visualize who Shaquille O'Neal played for from 1992 to 2011:
Getting ready
To follow this recipe, open B05527_05 – STARTER.twbx. Use the worksheet called Using Path, and connect to the Player Stats (NBA Players Regular Season 2009) data source:
You will also need to download the team logos you would like to use (and, of course, check the term agreements ...
Get Tableau 10 Business Intelligence Cookbook now with the O’Reilly learning platform.
O’Reilly members experience books, live events, courses curated by job role, and more from O’Reilly and nearly 200 top publishers.

