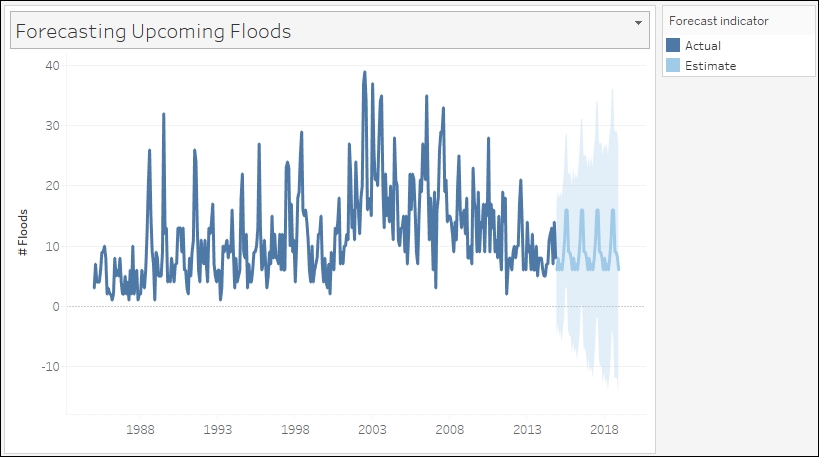
Visualizing forecast
Forecasting is the process of trying to predict what might happen in the future based on historical data and trends.
In this recipe, we will use Tableau's forecasting feature to forecast upcoming floods using flood data from 1985 to 2014:
Getting ready
To follow this recipe, open B05527_06 – STARTER.twbx. Use the worksheet called Forecasting and connect to the MasterTable (FlooddataMasterListrev) data source:
How to do it...
Here are the steps to create the view in this recipe:
- From Dimensions, right-click and drag the Began field to ...
Get Tableau 10 Business Intelligence Cookbook now with the O’Reilly learning platform.
O’Reilly members experience books, live events, courses curated by job role, and more from O’Reilly and nearly 200 top publishers.

