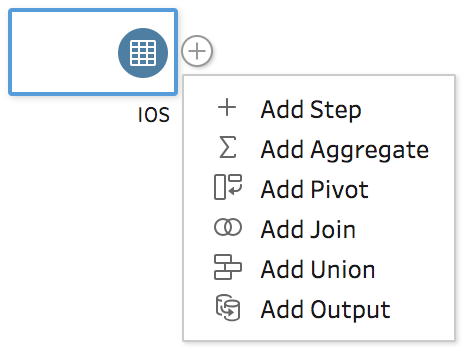
Once we've successfully connected the data and added data sources to the canvas, we can start to build our flow:
- Click on the + sign near the data source to choose the next step:

We have the following options:
|
Steps |
Description |
|
Add Step |
This step will allow us to look at the data and modify it. |
|
Add Aggregate |
We can calculate a new measure, using functions such as SUM, AVG, and COUNT. |
|
Add Pivot |
We can transpose columns into rows. In other words, we can convert cross-table into a normal table. |
|
Add Join |
We can join data streams using the INNER, LEFT, RIGHT, and OUTER joins. Moreover, Tableau ... |

