Chapter 13
Tracking Flow and Information Radiators
You now have a backlog full of work items, user stories that have been broken out into sprints, and a plan to get all of the features done within a certain time frame. Your team is ready to go. All you need now is a way to track progress through the sprints. What you need now is a highly visible area in which you can build your swim lanes of progress.
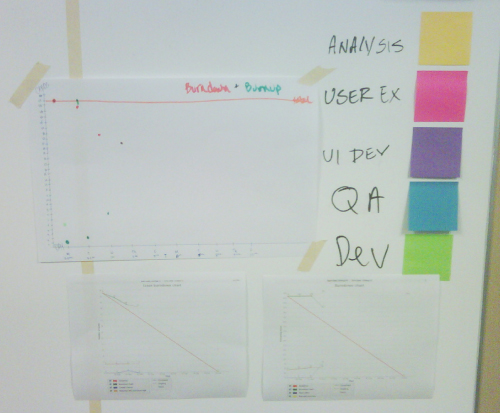
Your Agile Team's backlog has all the user stories, possibly hung on a wall somewhere. How do you track when the user stories get worked on? A simple process could be to start with three different swim lanes up on a wall: backlog, working, and done. Let's say a team member begins work on a user story; she moves it to the working section, and when she is complete, she moves it to the done swim lane. This simple flow is a great starting point for your team. Each team is different, and some enjoy breaking out swim lanes into very specific buckets. See what works best for your team. The charts discussed in this chapter, which can also be called information radiators, provide examples of what other Agile Teams have done to track progress and flow. (See Figures 13.1 and 13.2.)
Figure 13.1 Burndown Charts Make Useful Information Radiators

Figure 13.2 A Burndown Chart Tracking Workdays over Months
You have a great idea—two great ideas, in fact. They're called a Burndown Chart and a Release ...
Get The Agile Pocket Guide: A Quick Start to Making Your Business Agile Using Scrum and Beyond now with the O’Reilly learning platform.
O’Reilly members experience books, live events, courses curated by job role, and more from O’Reilly and nearly 200 top publishers.

