Chapter 25 Showing Actual versus Potential Utilization
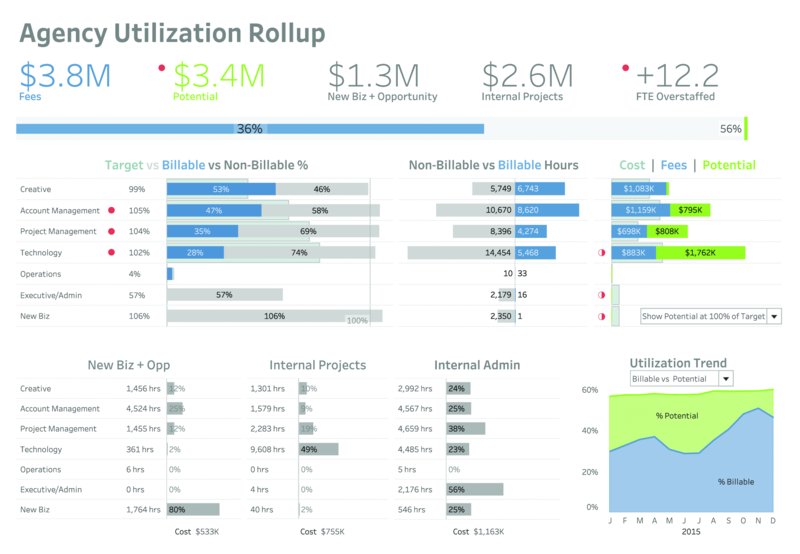
Utilization rollup dashboard.
Dashboard designer: Vanessa Edwards
Organization: Creative Performance Inc. (www.creativelyperform.com)
Scenario
Big Picture
You are the principal, chief operating officer, chief financial officer, or director of client services for a marketing agency (advertising, integrated, digital, design, etc.), trying to understand your agency's current performance in billable hours and fee income.
Fee income (also known as labor income) is the main source of revenue for most agencies and is directly linked to billable hours. Understanding where time is being spent across the agency is critical to managing staffing and to overall agency profitability. As direct labor cost is often the largest expense agencies have, to manage profitability effectively, you must be able to monitor labor costs in relation to your fee income and fee targets.
Specifics
You need to:
- Understand how time entry is spent across the agency including:
- billable time on client projects,
- nonbillable time generating new business,
- nonbillable time spent on internal agency projects, and
- nonbillable time spent on internal agency administration.
- See how each department is performing in relation to its target utilization.
- See if a department costs you more than its potential fee income and what you could be making in additional fee income ...
Get The Big Book of Dashboards now with the O’Reilly learning platform.
O’Reilly members experience books, live events, courses curated by job role, and more from O’Reilly and nearly 200 top publishers.

