Chapter 1. Introduction to Data Lakes
Data-driven decision making is changing how we work and live. From data science, machine learning, and advanced analytics to real-time dashboards, decision makers are demanding data to help make decisions. Companies like Google, Amazon, and Facebook are data-driven juggernauts that are taking over traditional businesses by leveraging data. Financial services organizations and insurance companies have always been data driven, with quants and automated trading leading the way. The Internet of Things (IoT) is changing manufacturing, transportation, agriculture, and healthcare. From governments and corporations in every vertical to non-profits and educational institutions, data is being seen as a game changer. Artificial intelligence and machine learning are permeating all aspects of our lives. The world is bingeing on data because of the potential it represents. We even have a term for this binge: big data, defined by Doug Laney of Gartner in terms of the three Vs (volume, variety, and velocity), to which he later added a fourth and, in my opinion, the most important V—veracity.
With so much variety, volume, and velocity, the old systems and processes are no longer able to support the data needs of the enterprise. Veracity is an even bigger problem for advanced analytics and artificial intelligence, where the principle of “GIGO” (garbage in = garbage out) is even more critical because it is virtually impossible to tell whether the data was bad and caused bad decisions in statistical and machine learning models or the model was bad.
To support these endeavors and address these challenges, a revolution is occurring in data management around how data is stored, processed, managed, and provided to the decision makers. Big data technology is enabling scalability and cost efficiency orders of magnitude greater than what’s possible with traditional data management infrastructure. Self-service is taking over from the carefully crafted and labor-intensive approaches of the past, where armies of IT professionals created well-governed data warehouses and data marts, but took months to make any changes.
The data lake is a daring new approach that harnesses the power of big data technology and marries it with agility of self-service. Most large enterprises today either have deployed or are in the process of deploying data lakes.
This book is based on discussions with over a hundred organizations, ranging from the new data-driven companies like Google, LinkedIn, and Facebook to governments and traditional corporate enterprises, about their data lake initiatives, analytic projects, experiences, and best practices. The book is intended for IT executives and practitioners who are considering building a data lake, are in the process of building one, or have one already but are struggling to make it productive and widely adopted.
What’s a data lake? Why do we need it? How is it different from what we already have? This chapter gives a brief overview that will get expanded in detail in the following chapters. In an attempt to keep the summary succinct, I am not going to explain and explore each term and concept in detail here, but will save the in-depth discussion for subsequent chapters.
Data-driven decision making is all the rage. From data science, machine learning, and advanced analytics to real-time dashboards, decision makers are demanding data to help make decisions. This data needs a home, and the data lake is the preferred solution for creating that home. The term was invented and first described by James Dixon, CTO of Pentaho, who wrote in his blog: “If you think of a datamart as a store of bottled water—cleansed and packaged and structured for easy consumption—the data lake is a large body of water in a more natural state. The contents of the data lake stream in from a source to fill the lake, and various users of the lake can come to examine, dive in, or take samples.” I italicized the critical points, which are:
-
The data is in its original form and format (natural or raw data).
-
The data is used by various users (i.e., accessed and accessible by a large user community).
This book is all about how to build a data lake that brings raw (as well as processed) data to a large user community of business analysts rather than just using it for IT-driven projects. The reason to make raw data available to analysts is so they can perform self-service analytics. Self-service has been an important mega-trend toward democratization of data. It started at the point of usage with self-service visualization tools like Tableau and Qlik (sometimes called data discovery tools) that let analysts analyze data without having to get help from IT. The self-service trend continues with data preparation tools that help analysts shape the data for analytics, and catalog tools that help analysts find the data that they need and data science tools that help perform advanced analytics. For even more advanced analytics generally referred to as data science, a new class of users called data scientists also usually make a data lake their primary data source.
Of course, a big challenge with self-service is governance and data security. Everyone agrees that data has to be kept safe, but in many regulated industries, there are prescribed data security policies that have to be implemented and it is illegal to give analysts access to all data. Even in some non-regulated industries, it is considered a bad idea. The question becomes, how do we make data available to the analysts without violating internal and external data compliance regulations? This is sometimes called data democratization and will be discussed in detail in subsequent chapters.
Data Lake Maturity
The data lake is a relatively new concept, so it is useful to define some of the stages of maturity you might observe and to clearly articulate the differences between these stages:
-
A data puddle is basically a single-purpose or single-project data mart built using big data technology. It is typically the first step in the adoption of big data technology. The data in a data puddle is loaded for the purpose of a single project or team. It is usually well known and well understood, and the reason that big data technology is used instead of traditional data warehousing is to lower cost and provide better performance.
-
A data pond is a collection of data puddles. It may be like a poorly designed data warehouse, which is effectively a collection of colocated data marts, or it may be an offload of an existing data warehouse. While lower technology costs and better scalability are clear and attractive benefits, these constructs still require a high level of IT participation. Furthermore, data ponds limit data to only that needed by the project, and use that data only for the project that requires it. Given the high IT costs and limited data availability, data ponds do not really help us with the goals of democratizing data usage or driving self-service and data-driven decision making for business users.
-
A data lake is different from a data pond in two important ways. First, it supports self-service, where business users are able to find and use data sets that they want to use without having to rely on help from the IT department. Second, it aims to contain data that business users might possibly want even if there is no project requiring it at the time.
-
A data ocean expands self-service data and data-driven decision making to all enterprise data, wherever it may be, regardless of whether it was loaded into the data lake or not.
Figure 1-1 illustrates the differences between these concepts. As maturity grows from a puddle to a pond to a lake to an ocean, the amount of data and the number of users grow—sometimes quite dramatically. The usage pattern moves from one of high-touch IT involvement to self-service, and the data expands beyond what’s needed for immediate projects.
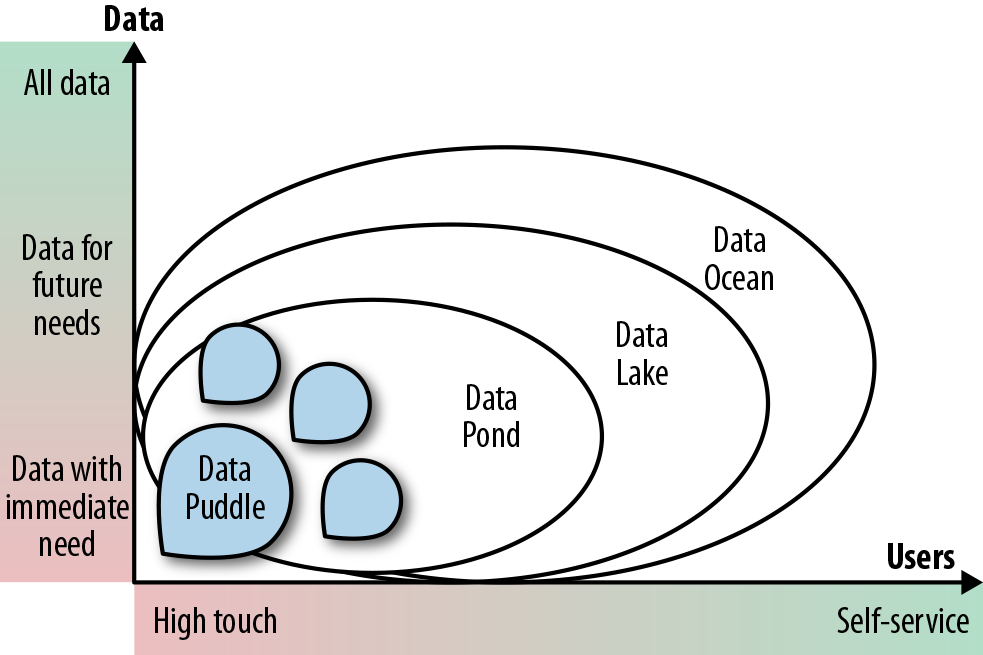
Figure 1-1. The four stages of maturity
The key difference between the data pond and the data lake is the focus. Data ponds provide a less expensive and more scalable technology alternative to existing relational data warehouses and data marts. Whereas the latter are focused on running routine, production-ready queries, data lakes enable business users to leverage data to make their own decisions by doing ad hoc analysis and experimentation with a variety of new types of data and tools, as illustrated in Figure 1-2.
Before we get into what it takes to create a successful data lake, let’s take a closer look at the two maturity stages that lead up to it.
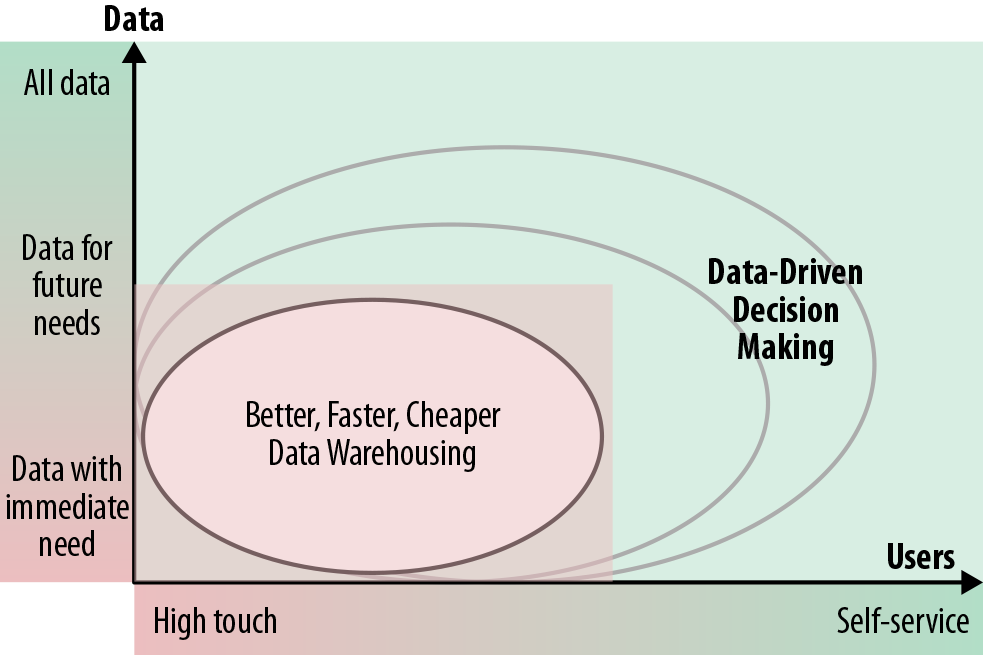
Figure 1-2. Value proposition of the data lake
Data Puddles
Data puddles are usually built for a small focused team or specialized use case. These “puddles” are modest-sized collections of data owned by a single team, frequently built in the cloud by business units using shadow IT. In the age of data warehousing, each team was used to building a relational data mart for each of its projects. The process of building a data puddle is very similar, except it uses big data technology. Typically, data puddles are built for projects that require the power and scale of big data. Many advanced analytics projects, such as those focusing on customer churn or predictive maintenance, fall in this category.
Sometimes, data puddles are built to help IT with automated compute-intensive and data-intensive processes, such as extract, transform, load (ETL) offloading, which will be covered in detail in later chapters, where all the transformation work is moved from the data warehouse or expensive ETL tools to a big data platform. Another common use is to serve a single team by providing a work area, called a sandbox, in which data scientists can experiment.
Data puddles usually have a small scope and a limited variety of data; they’re populated by small, dedicated data streams, and constructing and maintaining them requires a highly technical team or heavy involvement from IT.
Data Ponds
A data pond is a collection of data puddles. Just as you can think of data puddles as data marts built using big data technology, you can think of a data pond as a data warehouse built using big data technology. It may come into existence organically, as more puddles get added to the big data platform. Another popular approach for creating a data pond is as a data warehouse offload. Unlike with ETL offloading, which uses big data technology to perform some of the processing required to populate a data warehouse, the idea here is to take all the data in the data warehouse and load it into a big data platform. The vision is often to eventually get rid of the data warehouse to save costs and improve performance, since big data platforms are much less expensive and much more scalable than relational databases. However, just offloading the data warehouse does not give the analysts access to the raw data. Because the rigorous architecture and governance applied to the data warehouse are still maintained, the organization cannot address all the challenges of the data warehouse, such as long and expensive change cycles, complex transformations, and manual coding as the basis for all reports. Finally, the analysts often do not like moving from a finely tuned data warehouse with lightning-fast queries to a much less predictable big data platform, where huge batch queries may run faster than in a data warehouse but more typical smaller queries may take minutes. Figure 1-3 illustrates some of the typical limitations of data ponds: lack of predictability, agility, and access to the original untreated data.
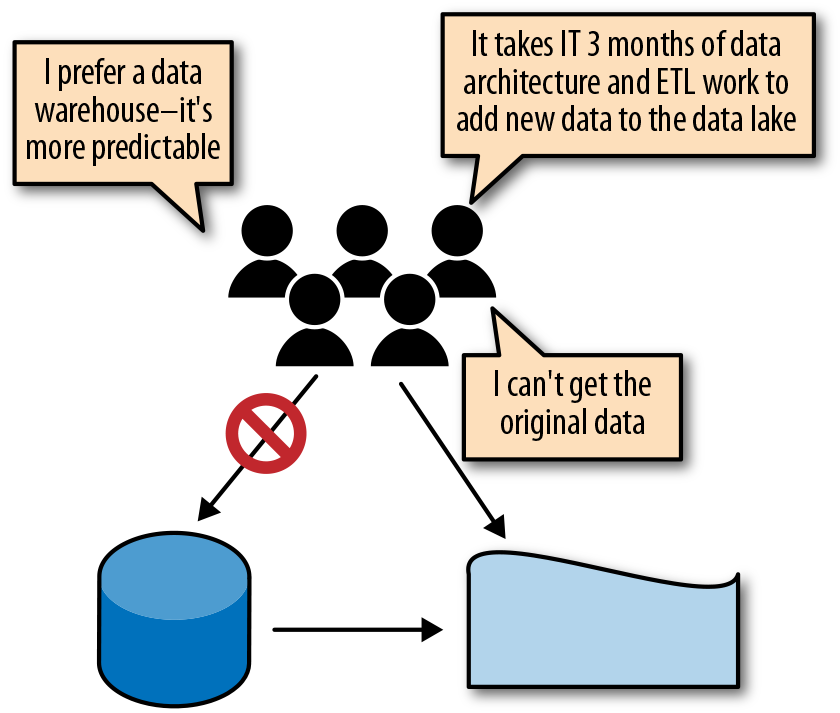
Figure 1-3. The drawbacks of data warehouse offloading
Creating a Successful Data Lake
So what does it take to have a successful data lake? As with any project, aligning it with the company’s business strategy and having executive sponsorship and broad buy-in are a must. In addition, based on discussions with dozens of companies deploying data lakes with varying levels of success, three key prerequisites can be identified:
-
The right platform
-
The right data
-
The right interfaces
The Right Platform
Big data technologies like Hadoop and cloud solutions like Amazon Web Services (AWS), Microsoft Azure, and Google Cloud Platform are the most popular platforms for a data lake. These technologies share several important advantages:
- Volume
-
These platforms were designed to scale out—in other words, to scale indefinitely without any significant degradation in performance.
- Cost
-
We have always had the capacity to store a lot of data on fairly inexpensive storage, like tapes, WORM disks, and hard drives. But not until big data technologies did we have the ability to both store and process huge volumes of data so inexpensively—usually at one-tenth to one-hundredth the cost of a commercial relational database.
- Variety
-
These platforms use filesystems or object stores that allow them to store all sorts of files: Hadoop HDFS, MapR FS, AWS’s Simple Storage Service (S3), and so on. Unlike a relational database that requires the data structure to be predefined (schema on write), a filesystem or an object store does not really care what you write. Of course, to meaningfully process the data you need to know its schema, but that’s only when you use the data. This approach is called schema on read and it’s one of the important advantages of big data platforms, enabling what’s called “frictionless ingestion.” In other words, data can be loaded with absolutely no processing, unlike in a relational database, where data cannot be loaded until it is converted to the schema and format expected by the database.
- Future-proofing
-
Because our requirements and the world we live in are in flux, it is critical to make sure that the data we have can be used to help with our future needs. Today, if data is stored in a relational database, it can be accessed only by that relational database. Hadoop and other big data platforms, on the other hand, are very modular. The same file can be used by various processing engines and programs—from Hive queries (Hive provides a SQL interface to Hadoop files) to Pig scripts to Spark and custom MapReduce jobs, all sorts of different tools and systems can access and use the same files. Because big data technology is evolving rapidly, this gives people confidence that any future projects will still be able to access the data in the data lake.
The Right Data
Most data collected by enterprises today is thrown away. Some small percentage is aggregated and kept in a data warehouse for a few years, but most detailed operational data, machine-generated data, and old historical data is either aggregated or thrown away altogether. That makes it difficult to do analytics. For example, if an analyst recognizes the value of some data that was traditionally thrown away, it may take months or even years to accumulate enough history of that data to do meaningful analytics. The promise of the data lake, therefore, is to be able to store as much data as possible for future use.
So, the data lake is sort of like a piggy bank (Figure 1-4)—you often don’t know what you are saving the data for, but you want it in case you need it one day. Moreover, because you don’t know how you will use the data, it doesn’t make sense to convert or treat it prematurely. You can think of it like traveling with your piggy bank through different countries, adding money in the currency of the country you happen to be in at the time and keeping the contents in their native currencies until you decide what country you want to spend the money in; you can then convert it all to that currency, instead of needlessly converting your funds (and paying conversion fees) every time you cross a border. To summarize, the goal is to save as much data as possible in its native format.

Figure 1-4. A data lake is like a piggy bank, allowing you to keep the data in its native or raw format
Another challenge with getting the right data is data silos. Different departments might hoard their data, both because it is difficult and expensive to provide and because there is often a political and organizational reluctance to share. In a typical enterprise, if one group needs data from another group, it has to explain what data it needs and then the group that owns the data has to implement ETL jobs that extract and package the required data. This is expensive, difficult, and time-consuming, so teams may push back on data requests as much as possible and then take as long as they can get away with to provide the data. This extra work is often used as an excuse to not share data.
With a data lake, because the lake consumes raw data through frictionless ingestion (basically, it’s ingested as is without any processing), that challenge (and excuse) goes away. A well-governed data lake is also centralized and offers a transparent process to people throughout the organization about how to obtain data, so ownership becomes much less of a barrier.
The Right Interface
Once we have the right platform and we’ve loaded the data, we get to the more difficult aspects of the data lake, where most companies fail—choosing the right interface. To gain wide adoption and reap the benefits of helping business users make data-driven decisions, the solutions companies provide must be self-service, so their users can find, understand, and use the data without needing help from IT. IT will simply not be able to scale to support such a large user community and such a large variety of data.
There are two aspects to enabling self-service: providing data at the right level of expertise for the users, and ensuring the users are able to find the right data.
Providing data at the right level of expertise
To get broad adoption for the data lake, we want everyone from data scientists to business analysts to use it. However, when considering such divergent audiences with different needs and skill levels, we have to be careful to make the right data available to the right user populations.
For example, analysts often don’t have the skills to use raw data. Raw data usually has too much detail, is too granular, and frequently has too many quality issues to be easily used. For instance, if we collect sales data from different countries that use different applications, that data will come in different formats with different fields (e.g., one country may have sales tax whereas another doesn’t) and different units of measure (e.g., lb versus kg, $ versus €).
In order for the analysts to use this data, it has to be harmonized—put into the same schema with the same field names and units of measure—and frequently also aggregated to daily sales per product or per customer. In other words, analysts want “cooked” prepared meals, not raw data.
Data scientists, on the other hand, are the complete opposite. For them, cooked data often loses the golden nuggets that they are looking for. For example, if they want to see how often two products are bought together, but the only information they can get is daily totals by product, data scientists will be stuck. They are like chefs who need raw ingredients to create their culinary or analytic masterpieces.
We’ll see in this book how to satisfy divergent needs by setting up multiple zones, or areas that contain data that meets particular requirements. For example, the raw or landing zone contains the original data ingested into the lake, whereas the production or gold zone contains high-quality, governed data. We’ll take a quick look at zones in “Organizing the Data Lake”; a more detailed discussion can be found in Chapter 7.
Getting to the data
Most companies that I have spoken with are settling on the “shopping for data” paradigm, where analysts use an Amazon.com-style interface to find, understand, rate, annotate, and consume data. The advantages of this approach are manifold, including:
- A familiar interface
-
Most people are familiar with online shopping and feel comfortable searching with keywords and using facets, ratings, and comments, so they require no or minimal training.
- Faceted search
-
Search engines are optimized for faceted search. Faceted search is very helpful when the number of possible search results is large and the user is trying to zero in on the right result. For example, if you were to search Amazon for toasters (Figure 1-5), facets would list manufacturers, whether the toaster should accept bagels, how many slices it needs to toast, and so forth. Similarly, when users are searching for the right data sets, facets can help them specify what attributes they would like in the data set, the type and format of the data set, the system that holds it, the size and freshness of the data set, the department that owns it, what entitlements it has, and any number of other useful characteristics.
- Ranking and sorting
-
The ability to present and sort data assets, widely supported by search engines, is important for choosing the right asset based on specific criteria.
- Contextual search
-
As catalogs get smarter, the ability to find data assets using a semantic understanding of what analysts are looking for will become more important. For example, a salesperson looking for customers may really be looking for prospects, while a technical support person looking for customers may really be looking for existing customers.

Figure 1-5. An online shopping interface
The Data Swamp
While data lakes always start out with good intentions, sometimes they take a wrong turn and end up as data swamps. A data swamp is a data pond that has grown to the size of a data lake but failed to attract a wide analyst community, usually due to a lack of self-service and governance facilities. At best, the data swamp is used like a data pond, and at worst it is not used at all. Often, while various teams use small areas of the lake for their projects (the white data pond area in Figure 1-6), the majority of the data is dark, undocumented, and unusable.
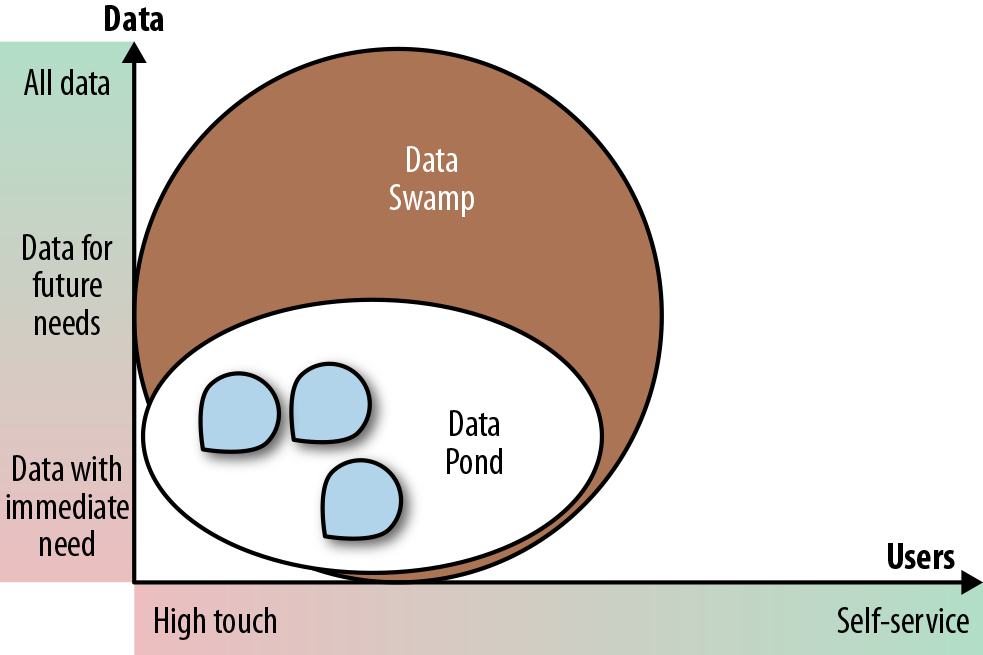
Figure 1-6. A data swamp
When data lakes first came onto the scene, a lot of companies rushed out to buy Hadoop clusters and fill them with raw data, without a clear understanding of how it would be utilized. This led to the creation of massive data swamps with millions of files containing petabytes of data and no way to make sense of that data.
Only the most sophisticated users were able to navigate the swamps, usually by carving out small puddles that they and their teams could make use of. Furthermore, governance regulations precluded opening up the swamps to a broad audience without protecting sensitive data. Since no one could tell where the sensitive data was, users could not be given access and the data largely remained unusable and unused. One data scientist shared with me his experience of how his company built a data lake, encrypted all the data in the lake to protect it, and required data scientists to prove that the data they wanted was not sensitive before it would unencrypt it and let them use it. This proved to be a catch-22: because everything was encrypted, the data scientist I talked to couldn’t find anything, much less prove that it was not sensitive. As a result, no one was using the data lake (or, as he called it, the swamp).
Roadmap to Data Lake Success
Now that we know what it takes for a data lake to be successful and what pitfalls to look out for, how do we go about building one? Usually, companies follow this process:
-
Stand up the infrastructure (get the Hadoop cluster up and running).
-
Organize the data lake (create zones for use by various user communities and ingest the data).
-
Set the data lake up for self-service (create a catalog of data assets, set up permissions, and provide tools for the analysts to use).
-
Open the data lake up to the users.
Standing Up a Data Lake
When I started writing this book back in 2015, most enterprises were building on-premises data lakes using either open source or commercial Hadoop distributions. By 2018, at least half of enterprises were either building their data lakes entirely in the cloud or building hybrid data lakes that are both on premises and in the cloud. Many companies have multiple data lakes, as well. All this variety is leading companies to redefine what a data lake is. We’re now seeing the concept of a logical data lake: a virtual data lake layer across multiple heterogeneous systems. The underlying systems can be Hadoop, relational, or NoSQL databases, on premises or in the cloud.
Figure 1-7 compares the three approaches. All of them offer a catalog that the users consult to find the data assets they need. These data assets either are already in the Hadoop data lake or get provisioned to it, where the analysts can use them.
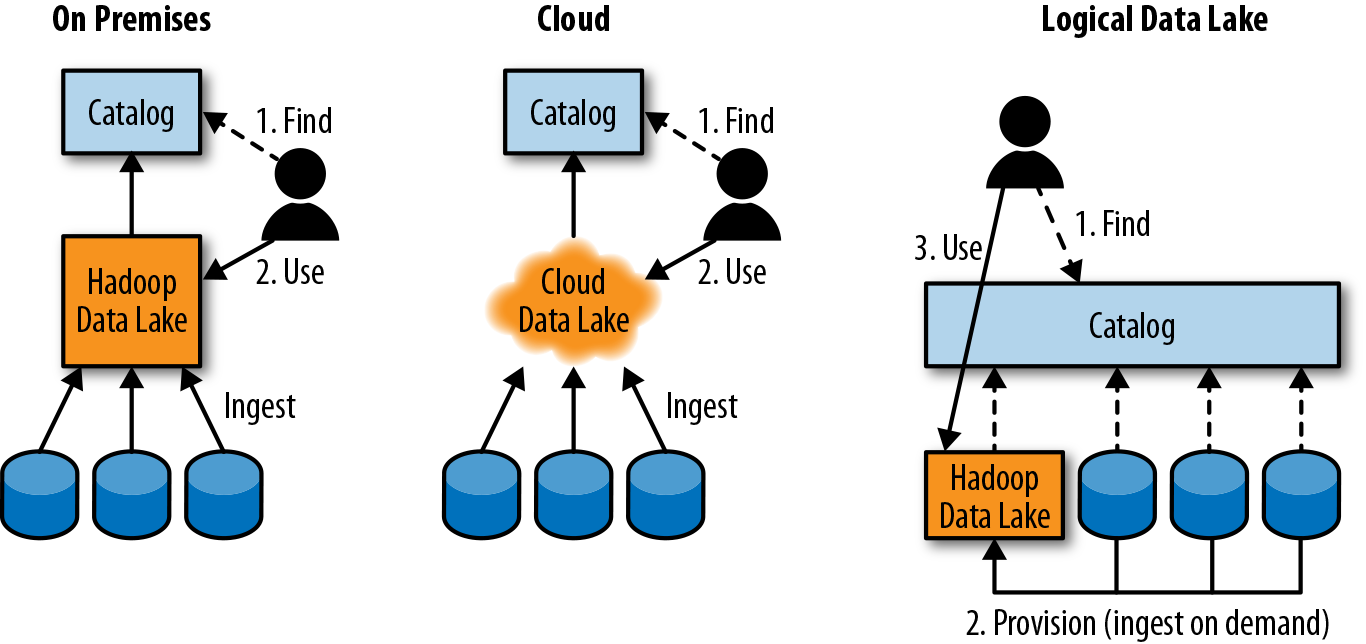
Figure 1-7. Different data lake architectures
Organizing the Data Lake
Most data lakes that I have encountered are organized roughly the same way, into various zones:
-
A raw or landing zone where data is ingested and kept as close as possible to its original state.
-
A gold or production zone where clean, processed data is kept.
-
A dev or work zone where the more technical users such as data scientists and data engineers do their work. This zone can be organized by user, by project, by subject, or in a variety of other ways. Once the analytics work performed in the work zone gets productized, it is moved into the gold zone.
Figure 1-8 illustrates this organization.
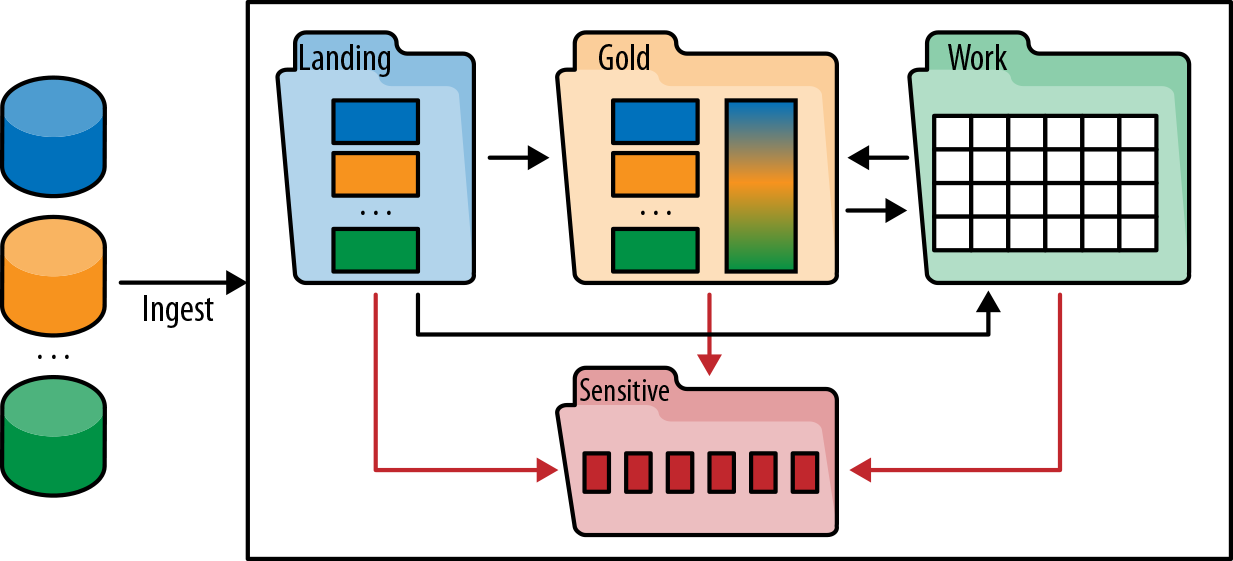
Figure 1-8. Zones of a typical data lake
For many years, the prevailing wisdom for data governance teams was that data should be subject to the same governance regardless of its location or purpose. In the last few years, however, industry analysts from Gartner have been promoting the concept of multi-modal IT—basically, the idea that governance should reflect data usage and user community requirements. This approach has been widely adopted by data lake teams, with different zones having different levels of governance and service-level agreements (SLAs). For example, data in the gold zone is usually strongly governed, is well curated and documented, and carries quality and freshness SLAs, whereas data in the work area has minimal governance (mostly making sure there is no sensitive data) and SLAs that may vary from project to project.
Different user communities naturally gravitate to different zones. Business analysts use data mostly in the gold zone, data engineers work on data in the raw zone (converting it into production data destined for the gold zone), and data scientists run their experiments in the work zone. While some governance is required for every zone to make sure that sensitive data is detected and secured, data stewards mostly focus on data in the sensitive and gold zones, to make sure it complies with company and government regulations. Figure 1-9 illustrates the different levels of governance and different user communities for different zones.
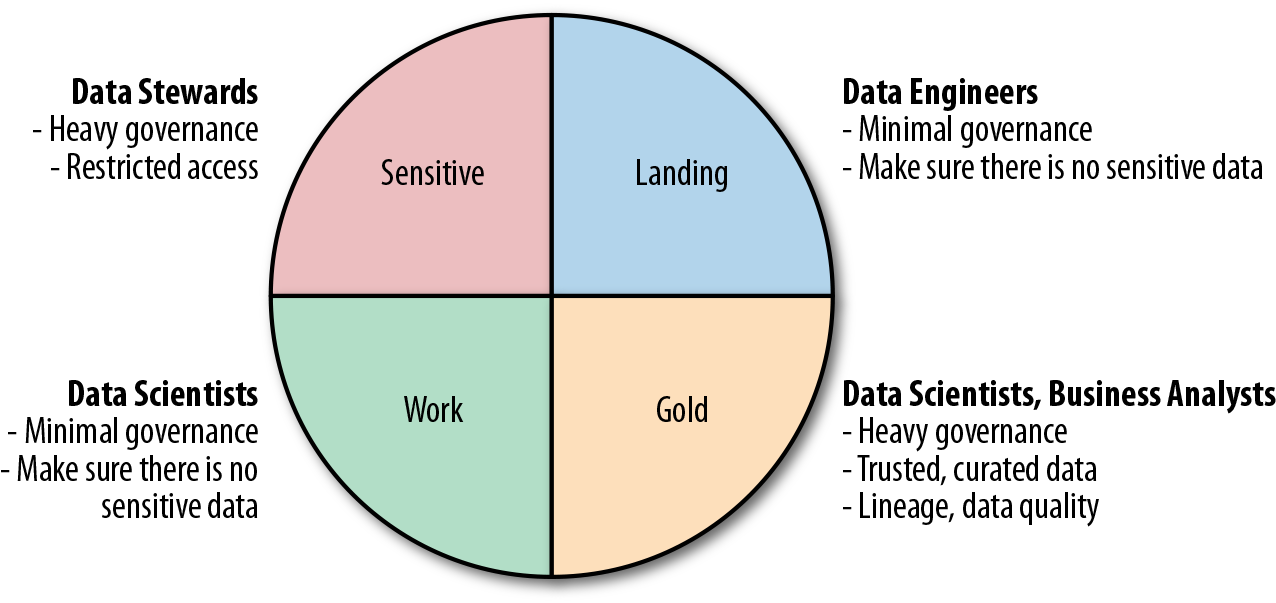
Figure 1-9. Governance expectations, zone by zone
Setting Up the Data Lake for Self-Service
Analysts, be they business analysts or data analysts or data scientists, typically go through four steps to do their job. These steps are illustrated in Figure 1-10.
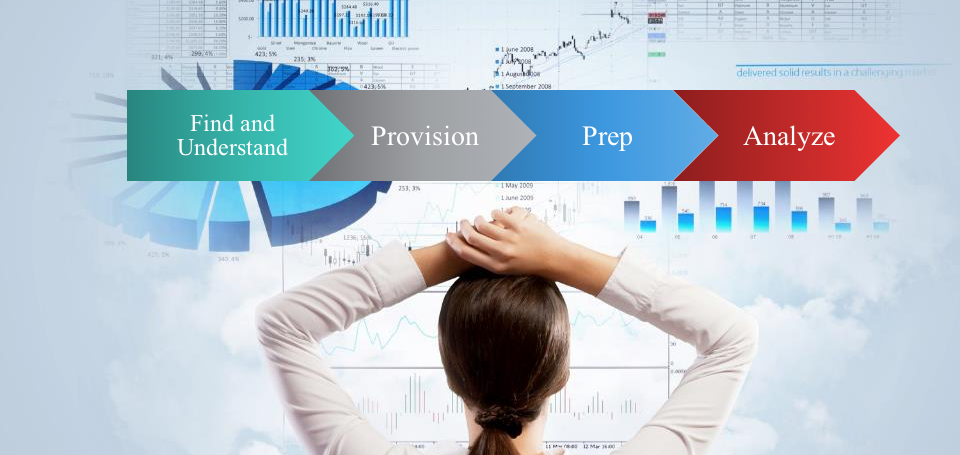
Figure 1-10. The four stages of analysis
The first step is to find and understand the data. Once they find the right data sets, they need to provision the data—that is, get access to it. Once they have the data, they often need to prep it—that is, clean it and convert it to a format appropriate for analysis. Finally, they need to use the data to answer questions or create visualizations and reports.
The first three steps theoretically are optional: if the data is well known and understood by the analyst, the analyst already has access to it, and it is already in the right shape for analytics, the analyst can do just the final step. In reality, a lot of studies have shown that the first three steps take up to 80% of a typical analyst’s time, with the biggest expenditure (60%) in the first step of finding and understanding the data (see, for example, “Boost Your Business Insights by Converging Big Data and BI” by Boris Evelson, Forrester Research, March 25, 2015).
Let’s break these down, to give you a better idea of what happens in each of the four stages.
Finding and understanding the data
Why is it so difficult to find data in the enterprise? Because the variety and complexity of the available data far exceeds human ability to remember it. Imagine a very small database, with only a hundred tables (some databases have thousands or even tens of thousands of tables, so this is truly a very small real-life database). Now imagine that each table has a hundred fields—a reasonable assumption for most databases, especially the analytical ones where data tends to be denormalized. That gives us 10,000 fields. How realistic is it for anyone to remember what 10,000 fields mean and which tables these fields are in, and then to keep track of them whenever using the data for something new?
Now imagine an enterprise that has several thousand (or several hundred thousand) databases, most an order of magnitude bigger than our hypothetical 10,000-field database. I once worked with a small bank that only had 5,000 employees, but managed to create 13,000 databases. I can only imagine how many a large bank with hundreds of thousands of employees might have. The reason I say “only imagine” is because none of the hundreds of large enterprises that I have worked with over my 30-year career were able to tell me how many databases they had—much less how many tables or fields.
Hopefully, this gives you some idea of the challenge analysts face when looking for data.
A typical project involves analysts “asking around” to see whether anyone has ever used a particular type of data. They get pointed from person to person until they stumble onto a data set that someone has used in one of their projects. Usually, they have no idea whether this is the best data set to use, how the data set was generated, or even whether the data is trustworthy. They are then faced with the awful choice of using this data set or asking around some more and perhaps not finding anything better.
Once they decide to use a data set, they spend a lot of time trying to decipher what the data it contains means. Some data is quite obvious (e.g., customer names or account numbers), while other data is cryptic (e.g., what does a customer code of 1126 mean?). So, the analysts spend still more time looking for people who can help them understand the data. We call this information “tribal knowledge.” In other words, the knowledge usually exists, but it is spread throughout the tribe and has to be reassembled through a painful, long, and error-prone discovery process.
Fortunately, there are new analyst crowdsourcing tools that are tackling this problem by collecting tribal knowledge through a process that allows analysts to document data sets using simple descriptions composed of business terms, and builds a search index to help them find what they are looking for. Tools like these have been custom-developed at modern data-driven companies such as Google and LinkedIn. Because data is so important at those companies and “everyone is an analyst,” the awareness of the problem and willingness to contribute to the solution is much higher than in traditional enterprises. It is also much easier to document data sets when they are first created, because the information is fresh. Nevertheless, even at Google, while some popular data sets are well documented, there is still a vast amount of dark or undocumented data.
In traditional enterprises, the situation is much worse. There are millions of existing data sets (files and tables) that will never get documented by analysts unless they are used—but they will never be found and used unless they are documented. The only practical solution is to combine crowdsourcing with automation. Waterline Data is a tool that my team and I have developed to provide such a solution. It takes the information crowdsourced from analysts working with their data sets and applies it to all the other dark data sets. The process is called fingerprinting: the tool crawls through all the structured data in the enterprise, adding a unique identifier to each field, and as fields get annotated or tagged by analysts, it looks for similar fields and suggests tags for them. When analysts search for data sets, they see both data sets tagged by analysts and data sets tagged by the tool automatically, and have a chance to either accept or reject these suggested tags. The tool then applies machine learning (ML) to improve its automated tagging based on the user feedback.
The core idea is that human annotation by itself is not enough, given the scope and complexity of the data, while purely automated annotation is undependable given the unique and unpredictable characteristics of the data—so, the two have to be brought together to achieve the best results. Figure 1-11 illustrates the virtuous cycle.
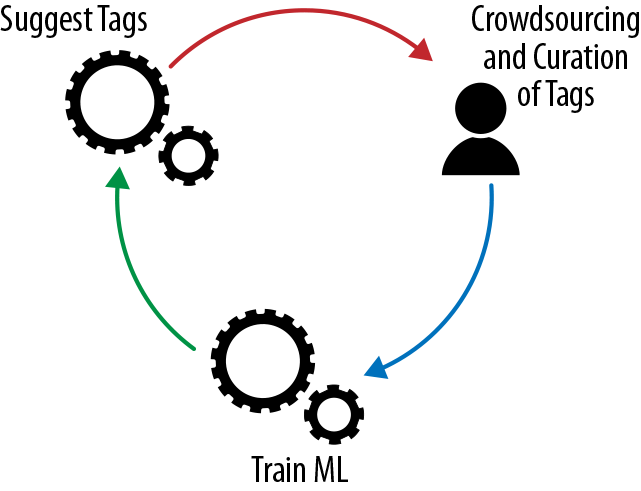
Figure 1-11. Leveraging both human knowledge and machine learning
Accessing and provisioning the data
Once the right data sets have been identified, analysts need to be able to use them. Traditionally, access is granted to analysts as they start or join a project. It is then rarely taken away, so old-timers end up with access to practically all the data in the enterprise that may be even remotely useful, while newbies have virtually no access and therefore can’t find or use anything. To solve the data access problem for the data lake, enterprises typically go for one of the two extremes: they either grant everyone full access to all the data or restrict all access unless an analyst can demonstrate a need. Granting full access works in some cases, but not in regulated industries. To make it more acceptable, enterprises sometimes deidentify sensitive data—but that means they have to do work ingesting data that no one may need. Also, as regulations change, more and more data may need to be deidentified (this topic will be covered in depth in later chapters).
A more practical approach is to publish information about all the data sets in a metadata catalog, so analysts can find useful data sets and then request access as needed. The requests usually include the justification for access, the project that requires the data, and the duration of access required. These requests are routed to the data stewards for the requested data. If they approve access, it is granted for a period of time. This period may be extended, but it is not indefinite, eliminating the legacy access problem. An incoming request may also trigger the work to deidentify sensitive data, but now it is done only if and when needed.
Provisioning or physical access can be granted to the data in a number of ways:
-
Users can be granted read access to the entire data set.
-
If only partial access should be granted, a copy of the file containing just the data appropriate to the user can be created (and kept up to date), or a Hive table or view can be created that contains only the fields and rows that the analyst should see.
-
If needed, a deidentified version of the data set can be generated that replaces sensitive information with randomly generated equivalent information, so all the applications still work, but no sensitive data is leaked.
Preparing the data
Occasionally, data comes in perfectly clean and ready for analytics. Unfortunately, most of the time, the data needs work to render it appropriate for the analysts. Data preparation generally involves the following operations:
- Shaping
-
Selecting a subset of fields and rows to work on, combining multiple files and tables into one (joining), transforming and aggregating, bucketizing (for instance, going from discrete values to ranges or buckets—e.g., putting 0- to 18-year-olds into the “juvenile” bucket, 19- to 25-year-olds into the “young adult” bucket, etc.), converting variables into features (for instance, converting age into a feature that has a value of 0 if a person is over 65 and 1 if not), and many other possible steps.
- Cleaning
-
Filling in missing values (for instance, guessing a missing gender from the first name or looking up the address in an address database), correcting bad values, resolving conflicting data, normalizing units of measure and codes to common units, and the like.
- Blending
-
Harmonizing different data sets to the same schema, same units of measure, same codes, and so on.
As you can tell from these few examples, a lot of sophisticated work and thinking goes into data preparation. Automation is crucial, to take advantage of lessons learned by transformations and to avoid repeating the same tedious steps over thousands of tables and data sets.
The most common data preparation tool is Excel. Unfortunately, Excel doesn’t scale to data lake sizes, but a plethora of new tools provide Excel-like capabilities for large-scale data sets. Some, like Trifacta, apply sophisticated machine learning techniques to suggest transformations and help analysts prep the data. Many large vendors have also debuted data prep tools, and analytics vendors like Tableau and Qlik are enhancing data prep capabilities in their tools as well.
Analysis and visualization
Once data is prepared, it can be analyzed. Analysis ranges from creation of simple reports and visualizations to sophisticated advanced analytics and machine learning. This is a very mature space, with hundreds of vendors providing solutions for every type of analytics. Specifically for Hadoop data lakes, Arcadia Data, AtScale, and others provide analysis and visualization tools designed to run natively and take advantage of Hadoop’s processing power.
Data Lake Architectures
Originally, most companies I talked to thought that they would have one huge, on-premises data lake that would contain all their data. As their understanding and best practices evolved, most enterprises realized that a single go-to point was not ideal. Between data sovereignty regulations (e.g., you are not allowed to take data out of Germany) and organizational pressures, multiple data lakes typically proved to be a better solution. Furthermore, as companies realized the complexity of supporting a massively parallel cluster and experienced the frustration at their inability to find and hire experienced administrators for Hadoop and other big data platforms, they started opting for cloud-based data lakes where most hardware and platform components are managed by the experts that work for Amazon, Microsoft, Google, and others.
Data Lakes in the Public Cloud
Aside from the benefits of access to big data technology expertise and short deployment times, the low cost of storage and the elastic nature of cloud computing make this an extremely attractive option for implementing a data lake. Since a lot of data is being stored for future use, it makes sense to store it as inexpensively as possible. This works well with the cost optimization possibilities supported through various storage tiers provided by Amazon and others: access ranges from high-speed to glacial, with slower-access media being significantly cheaper.
In addition, the elasticity of cloud computing allows a very large cluster to be spun up on demand, when needed. Compare this to an on-premises cluster, which has a fixed size and stores its data in attached storage (although new architectures with network-attached storage are being explored). That means that as nodes fill up with data, new nodes need to be added just for storage. Furthermore, if analytic loads are CPU-heavy and need more compute power, you need to add nodes even though you may only use them for a short time.
In the cloud, you pay only for the storage that you need (i.e., you don’t have to buy extra compute nodes just to get more storage) and can spin up huge clusters for short periods of time. For example, if you have a 100-node on-premises cluster and a job that takes 50 hours, it is not practical to buy and install 1,000 nodes just to make this one job run faster. In the cloud, however, you would pay about the same for the compute power of 100 nodes for 50 hours as you would for 1,000 nodes for 5 hours. This is the huge advantage of elastic compute.
Logical Data Lakes
Once enterprises realized that having one centralized data lake wasn’t a good solution, the idea of the logical data lake took hold. With this approach, instead of loading all the data into the data lake just in case someone may eventually need it, it is made available to analysts through a central catalog or through data virtualization software.
Logical data lakes address the issues of completeness and redundancy, as illustrated in Figure 1-12.
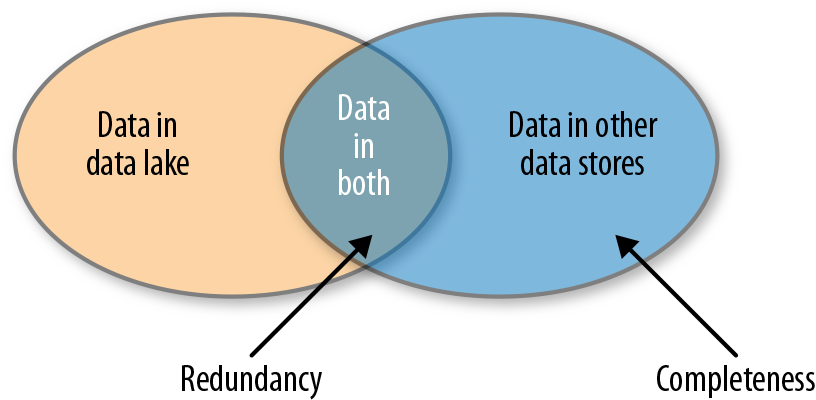
Figure 1-12. Completeness and redundancy issues
These issues can be summarized as follows:
- Completeness
-
How do analysts find the best data set? If the analysts can find only data that is already in the data lake, other data that has not been ingested into the data lake won’t be found or used (the crescent area on the right in Figure 1-12).
- Redundancy
-
If we ingest all the data into the data lake, we will have redundancy between the sources of data and the data lake (illustrated as the area of overlap between the two circles in Figure 1-12). With multiple data lakes, to achieve completeness we would need to ingest the same data into each data lake.
To make matters worse, there is already a lot of redundancy in the enterprise. Traditionally, when a new project is started, the most expedient and politically simple approach is for the project team to spin up a new data mart, copy data from other sources or the data warehouse, and add its own unique data. This is much easier than studying existing data marts and negotiating shared usage with current owners and users. As a result, there is a proliferation of data marts that are mostly the same. If we blindly load all the data from these data marts into the data lake, we will have extremely high levels of redundancy in our lake.
The best approach to the completeness and redundancy challenges that I have seen involves a couple of simple rules:
-
To solve the completeness problem, create a catalog of all the data assets, so the analysts can find and request any data set that is available in the enterprise.
-
To solve the redundancy problem, follow the process shown in Figure 1-13:
-
Store data that is not stored anywhere else in the data lake.
-
Bring data that is stored in other systems into the data lake if and when it is needed, and keep it in sync while it is needed.
-
Bring each data set in only once for all users.
-
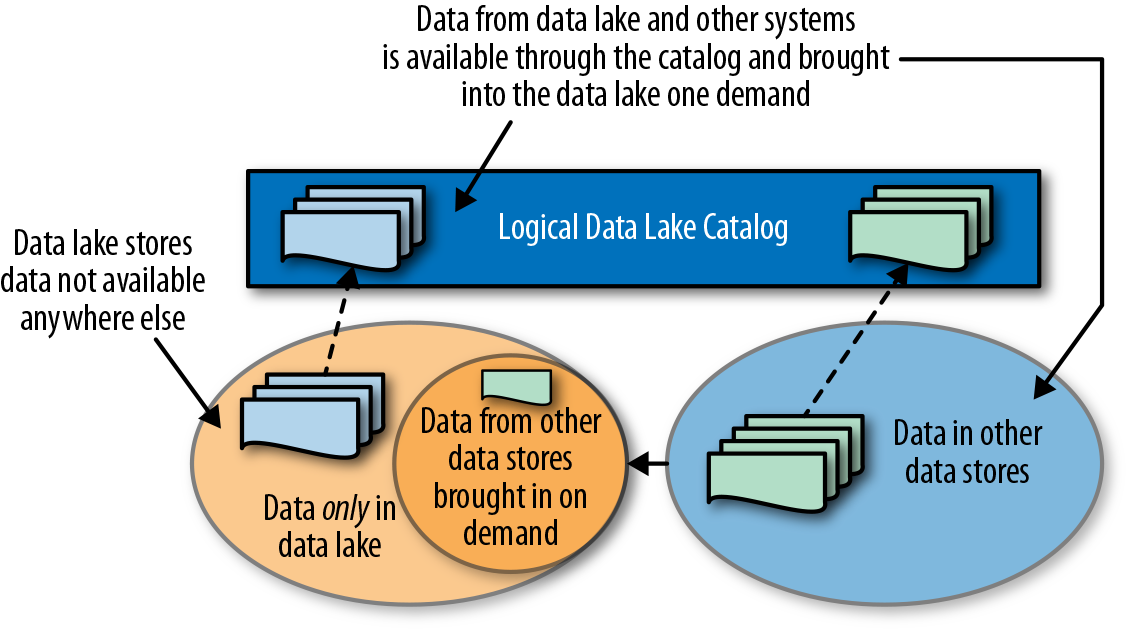
Figure 1-13. Managing data in the logical data lake
Virtualization versus a catalog-based logical data lake
Virtualization (sometimes also called federation or EII, for enterprise information integration) is a technology developed in 1980s and improved through several generations into the 2010s. It basically creates a virtual view or table that hides the location and implementation of the physical tables. In Figure 1-14, a view is created by joining two tables from different databases. The query would then query that view and leave it up to the data virtualization system to figure out how to access and join the data in the two databases.
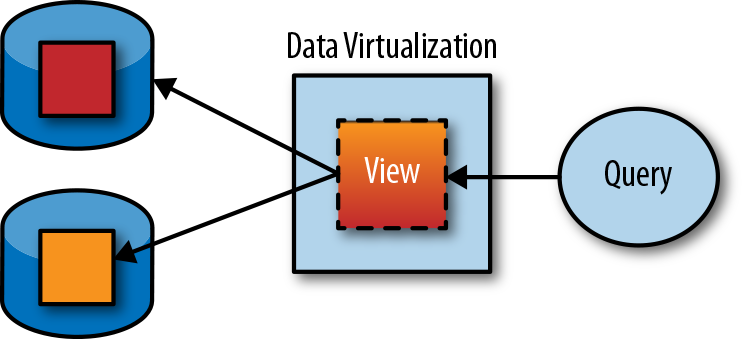
Figure 1-14. Creating a custom data set through a view
Although this technology works well for some use cases, in a logical data lake, to achieve completeness, it would require every data set to be published as a virtual table and kept up to date as underlying table schemas change.
Even if the initial problem of publishing every data asset were solved, views still present significant problems:
-
Creating a virtual view does not make data any easier to find.
-
Joining data from multiple heterogeneous systems is complex and compute-intensive, often causing massive loads on the systems and long execution cycles. These so-called distributed joins of tables that don’t fit into memory are notoriously eresource intensive.
By contrast, in the catalog-driven approach, only metadata about each data set is published, in order to make it findable. Data sets are then provisioned to the same system (e.g., Hadoop cluster) to be processed locally, as demonstrated in Figure 1-15.
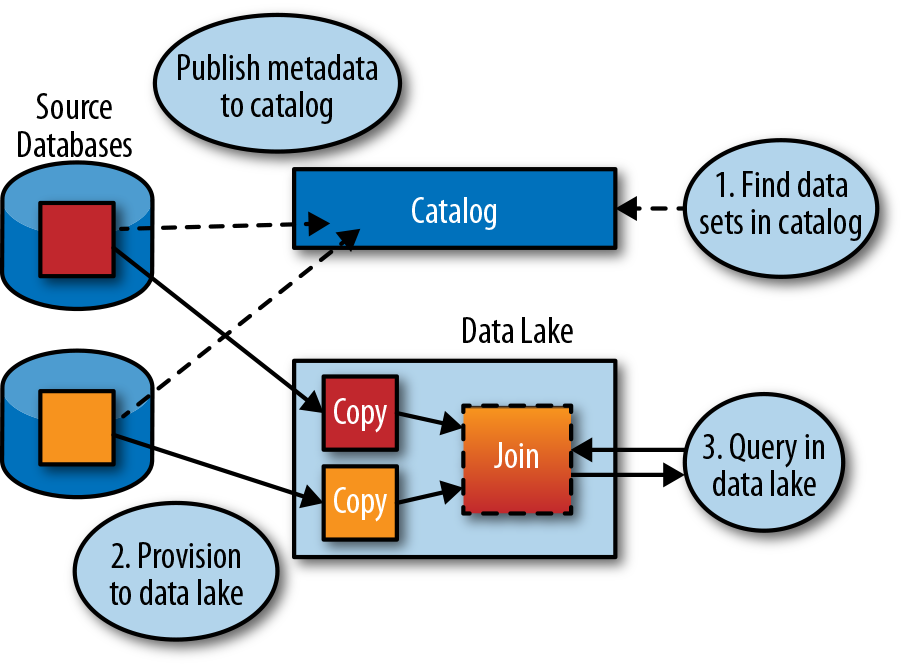
Figure 1-15. Providing metadata through a catalog
In addition to making all the data findable and accessible to analysts, an enterprise catalog can serve as a single point of access, governance, and auditing, as shown in Figure 1-16. On the top, without a centralized catalog, access to data assets is all over the place and difficult to manage and track. On the bottom, with the centralized catalog, all requests for access go through the catalog. Access is granted on demand for a specific period of time and is audited by the system.
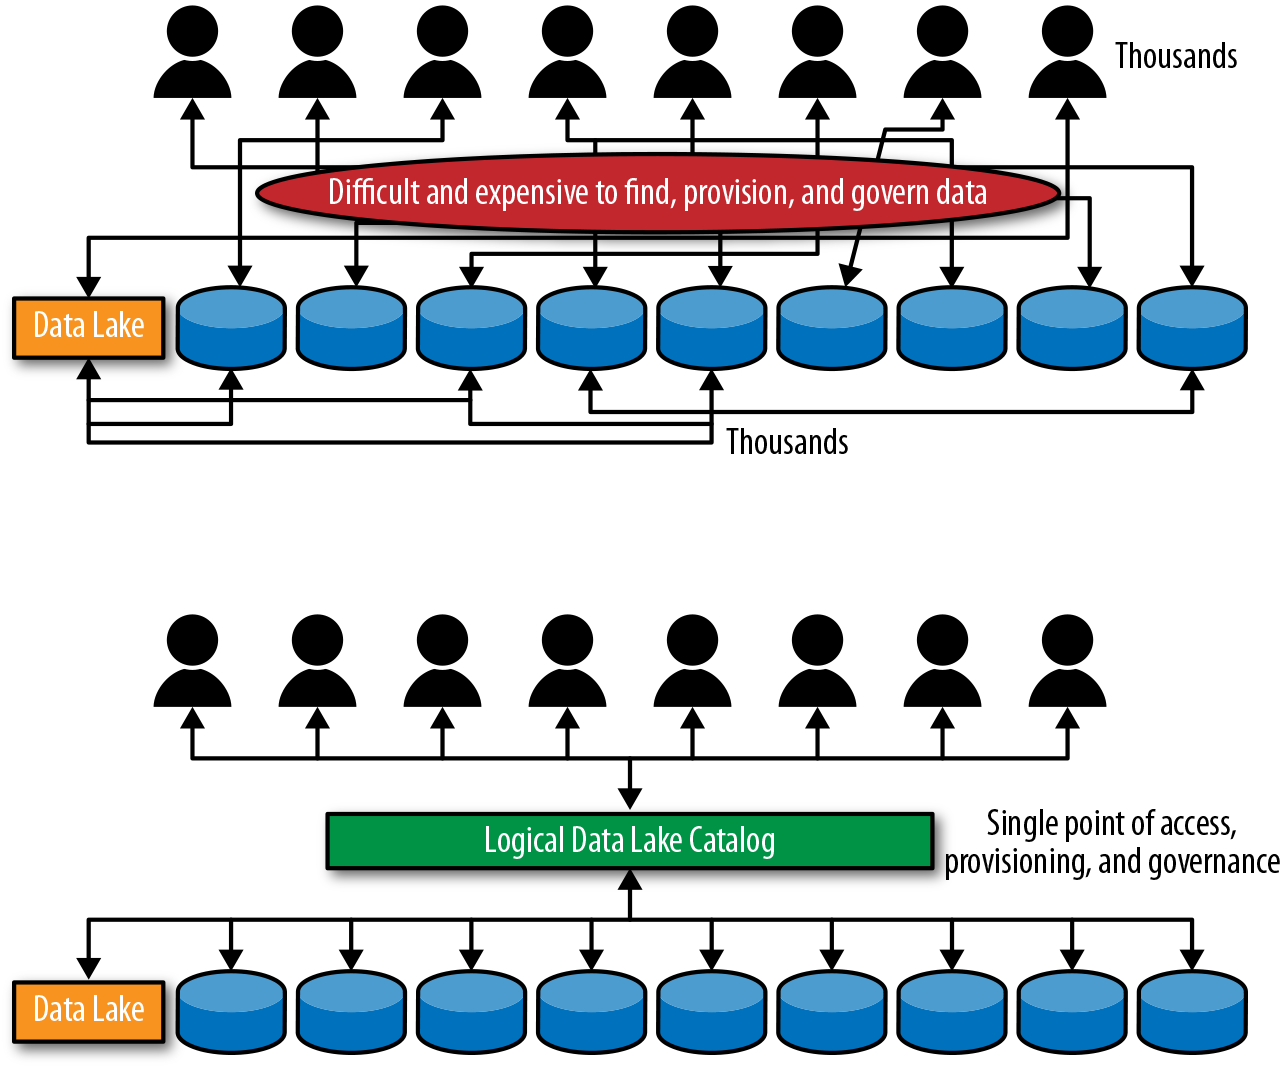
Figure 1-16. Data provisioning and governance through the catalog
Get The Enterprise Big Data Lake now with the O’Reilly learning platform.
O’Reilly members experience books, live events, courses curated by job role, and more from O’Reilly and nearly 200 top publishers.

