Chapter 10Mapping Price Action
The purpose of this chapter is to explain the first steps in conducting technical analysis of forex prices. These steps involve finding support and resistance, trend lines, and assessing where the price is in relationship to these geometric points.
Projecting Horizontal Support and Resistance Points
Where is the currency pair price and what is it doing? This question is quite basic, but it involves many levels of analysis. Understanding the location of the currency pair is a foundational beginning of technical analysis and will reveal a great deal of information that a trader can use in formulating trading strategy.
But how do we know where to look? The basic technical measurement of horizontal support and resistance provides the ground floor of technical analysis. Whenever you look at a currency pair, you have to ask where support is and where resistance is. The answers provide the first mapping of the market.
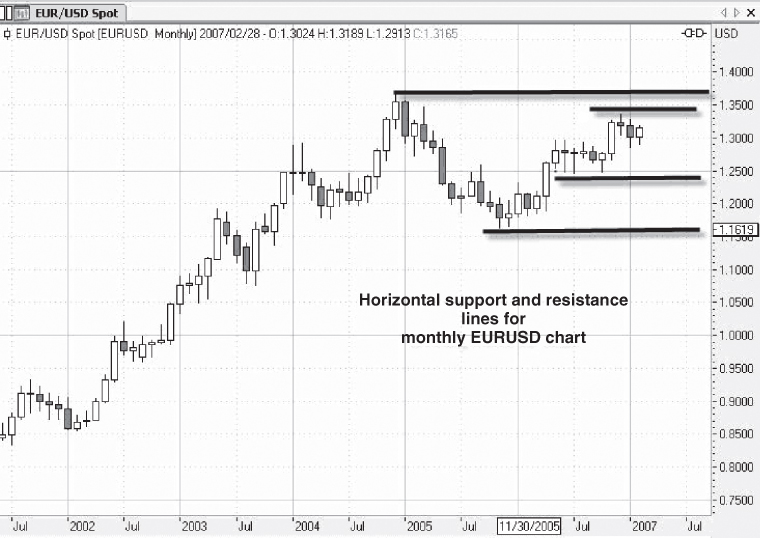
Support is where the price stops falling, and resistance is where it stops rising. The process for locating support and resistance is fairly straightforward. Figure 10.1 includes several support and resistance lines. Those lines that form floors and ceilings are outer support and resistance containing the price action within a range. Those lines that are inside these larger lines are inner support and resistance.

Figure 10.1 Horizontal ...
Get The Forex Trading Course: A Self-Study Guide to Becoming a Successful Currency Trader, 2nd Edition now with the O’Reilly learning platform.
O’Reilly members experience books, live events, courses curated by job role, and more from O’Reilly and nearly 200 top publishers.

