Basic Debugging PL/SQL Code
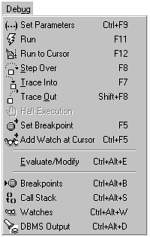
The TOAD debugger is easily accessed by using the nine buttons on the right side of the Procedure Editor toolbar (middle toolbar). See Figure 4.48. These same functions are also accessible from the Debug menu (see Figure 4.49), and all of the functions have a shortcut keystroke as well.
Figure 4.48. The Debug toolbar.
![]()
Figure 4.49. The Debug drop-down menu.

The following keystrokes access many of the Debug features.
F11 = Run |
Ctrl+F9 = Set Parameters |
F8 = Step Over |
F7 = Trace Into |
Shift+F8 = Trace Out |
Get TOAD® Handbook now with the O’Reilly learning platform.
O’Reilly members experience books, live events, courses curated by job role, and more from O’Reilly and nearly 200 top publishers.

