Chapter 12. Trino in Production
After learning about and installing Trino, first as a simple exploratory setup in Chapter 2 and then as a deployment in Chapter 5, you now get to dive into further details. After all, simply installing and configuring a cluster is a very different task from keeping it up and running day and night, with different users and changing data sources and entirely separate usage.
In this chapter you are therefore getting to explore other aspects you need to learn about in order to be a successful operator of your Trino clusters.
Monitoring with the Trino Web UI
As discussed in “Trino Web UI”, the Trino Web UI is accessible on every Trino cluster coordinator and can be used to inspect and monitor the Trino cluster and processed queries. The detailed information provided can be used to better understand and tune the Trino system overall as well as individual queries.
Note
The Trino Web UI exposes information from the Trino system tables, discussed in “Trino System Tables”.
When you first navigate to the Trino Web UI address, you see the main dashboard shown in Figure 12-1. It displays Trino cluster information in the top section and a list of queries in the bottom section.
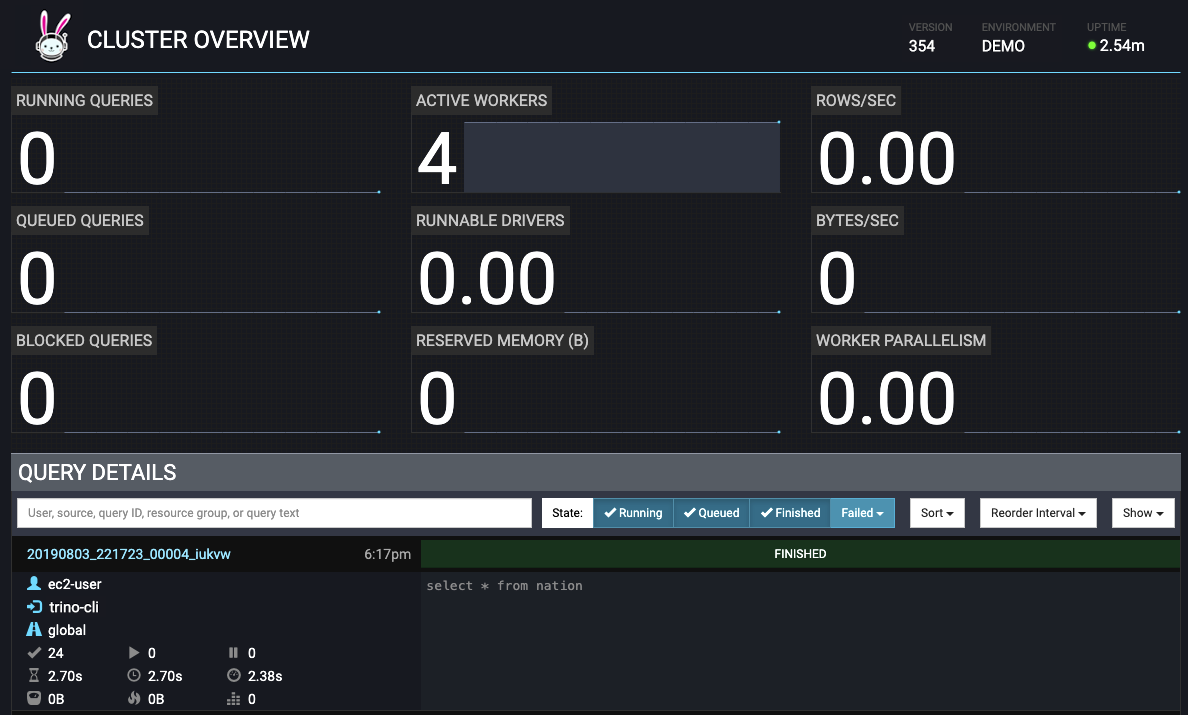
Figure 12-1. Trino Web UI main dashboard
Cluster-Level Details
Let’s first discuss the Trino cluster information:
- Running Queries
-
The total number of queries currently running in ...
Get Trino: The Definitive Guide now with the O’Reilly learning platform.
O’Reilly members experience books, live events, courses curated by job role, and more from O’Reilly and nearly 200 top publishers.

