
 A Jeu de Paume Before a Country Palace, by Adriaen van de Venne, 1614. (source: Getty's Open Content Program)
 Executive Summary
In 2016, O’Reilly Media conducted a data science salary survery online. The survey contained 40
questions about the respondents’ roles, tools, compensation,
and demographic backgrounds. About 1,000 data scientists,
analysts, engineers, and other professionals
working in Data participated in the
survey—359 of them from European
countries. Here, we
take a deep dive into the results from
respondents based in Europe, exploring
career details and factors that
influence salary. Some key findings
include:
Most of the variation in salaries can be attributed to differences in the local economy
Data professionals who use Hadoop and Spark earn more
Among those who use R or Python, users of both have the highest salaries
A few technical tasks correlate with higher salaries: developing prototype models, setting up/maintaining data platforms, and developing products that depend on real-time analytics
Respondents who use Hadoop, Spark, or Python were twice as likely to have a major increase in salary over the last three years, compared with those whose stack consists of Excel and relational databases
Note
Respondents who use Hadoop, Spark, or Python were twice as likely to have a major increase in salary over the last three years.
We hope that these findings will be
useful as you develop your career in data science.
Introduction
SINCE 2013, WE HAVE CONDUCTED AN ONLINE SALARY
SURVEY FOR DATA PROFESSIONALS and published a
report on our findings. US respondents typically dominate
the sample, at about 60%–70%. Although many of the
findings do appear to apply to people across the globe, we
thought it would be useful to show results specific to Europe,
looking at finer geographical details and identifying any patterns
that seem to only apply to Europe. In this report, we pool all
359 European respondents from the Data Salary Survey over a
13-month period: September 2015 to October 2016.
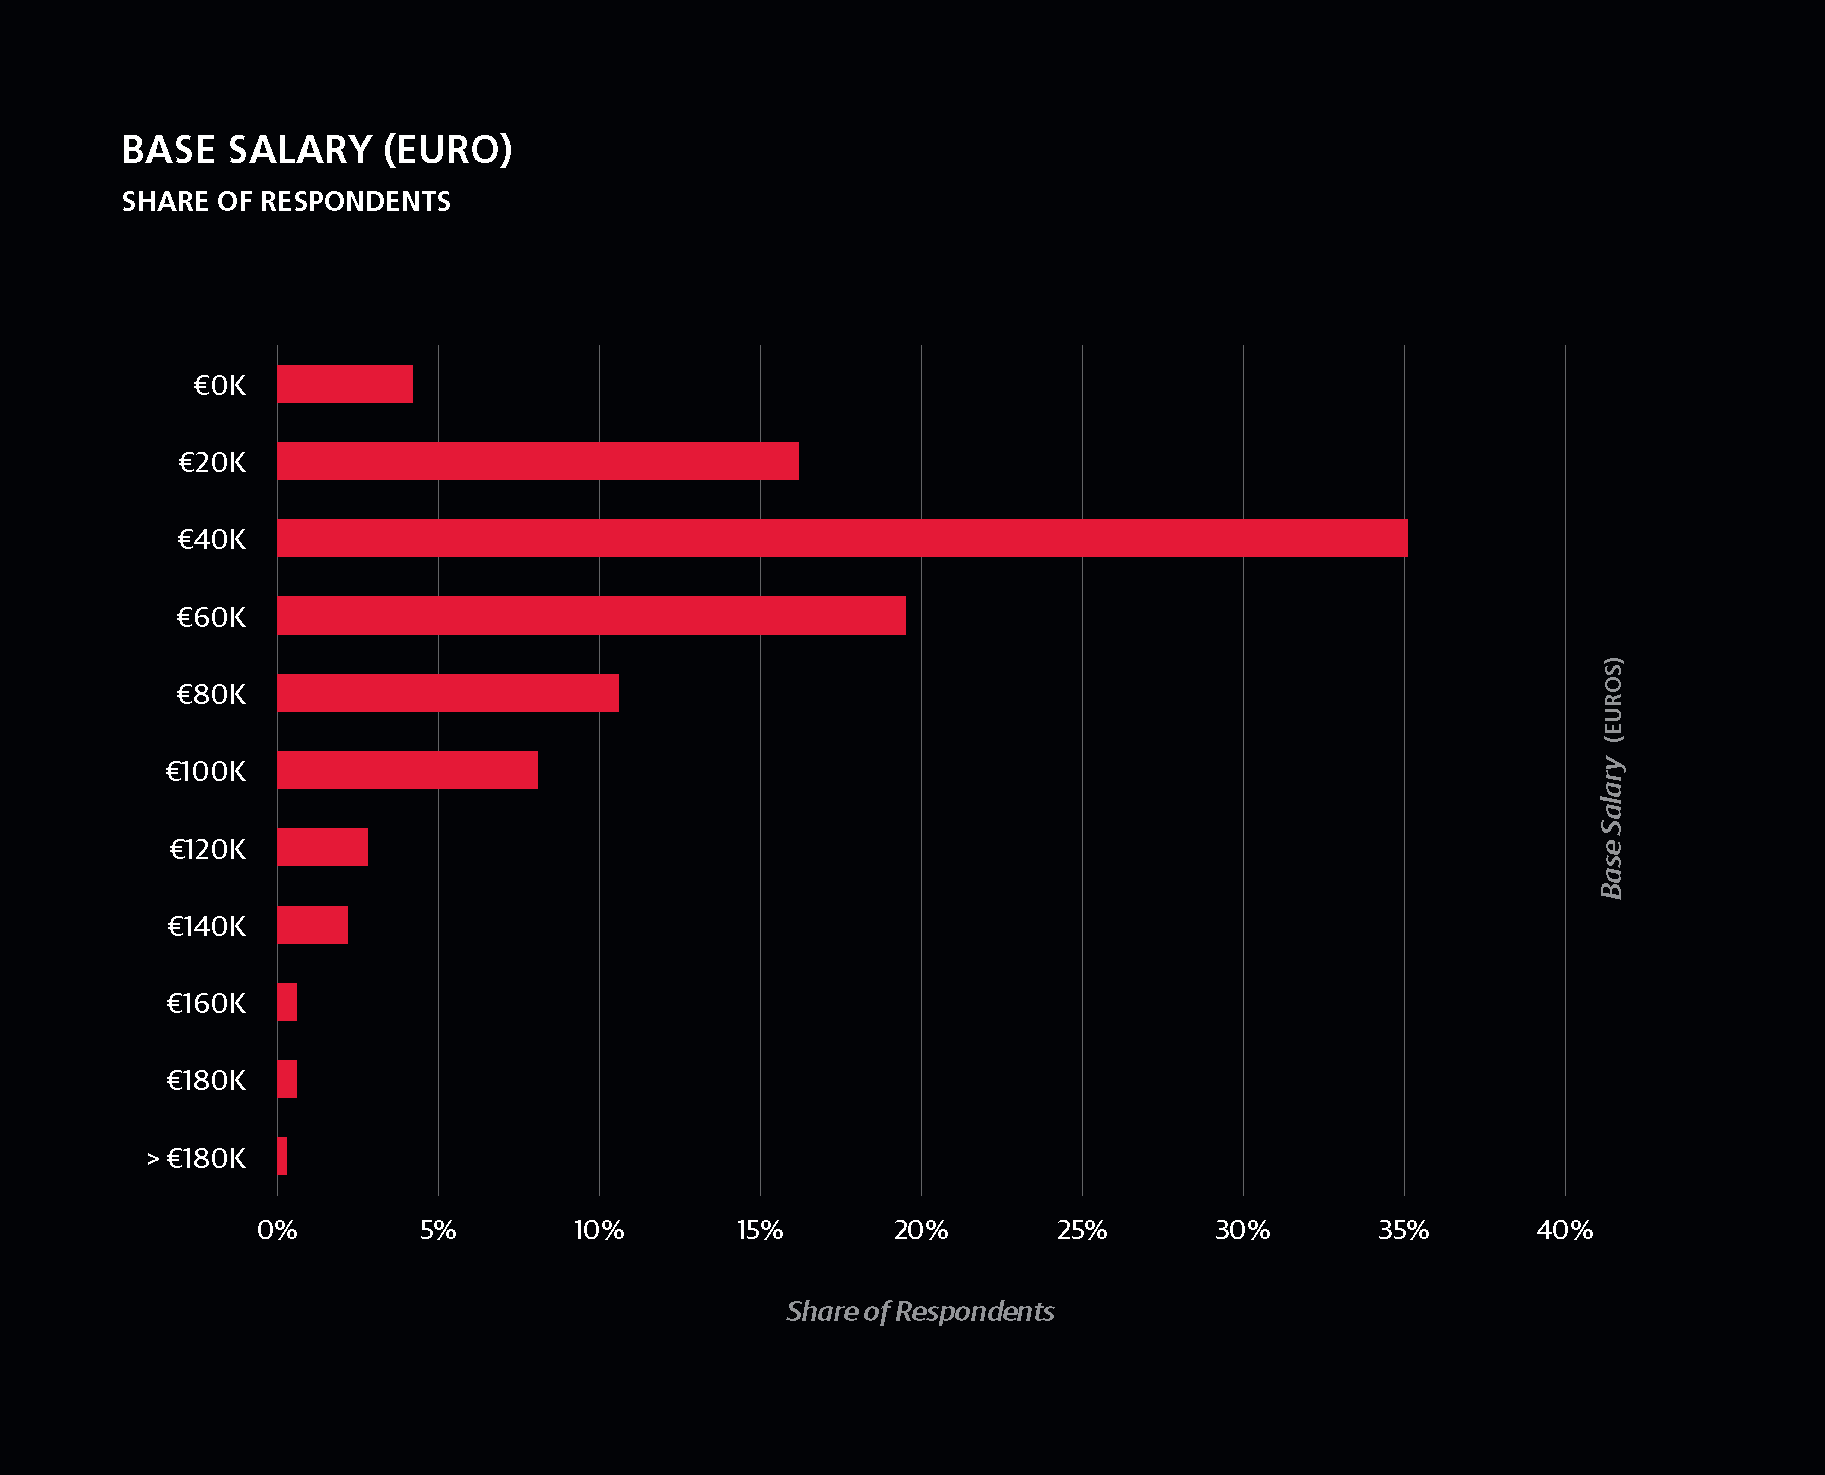
The median salary of European respondents was €48K,
but the spread was huge. For example, the top third earned
almost four times on average as the bottom third. Such a
large variance is not surprising due to the differences in the
per capita income of countries represented.
A note on currency: we requested responses about salaries
and other monetary amounts in US dollars. In this report, we
have converted all amounts into euros, though many European
respondents are paid in other currencies, such as pounds or
rubles. Over the period in which responses were collected,
there were some important shifts in exchange rates, most
notably the fall of the pound after Brexit. However, the
geographical distribution of responses did not correlate in any
meaningful way with any period of collection (e.g., when the
pound was high or low), so these currency fluctuations likely
translate into noise rather than bias.
Note
In the horizontal bar charts throughout this report, we include
the interquartile range (IQR) to show the middle 50% of
respondents’ answers to questions such as salary. One quarter
of the respondents have a salary below the displayed range,
and one quarter have a salary above the displayed range.
The IQRs are represented by colored, horizontal bars. On each
of these colored bars, the white vertical band represents the
median value.
Countries
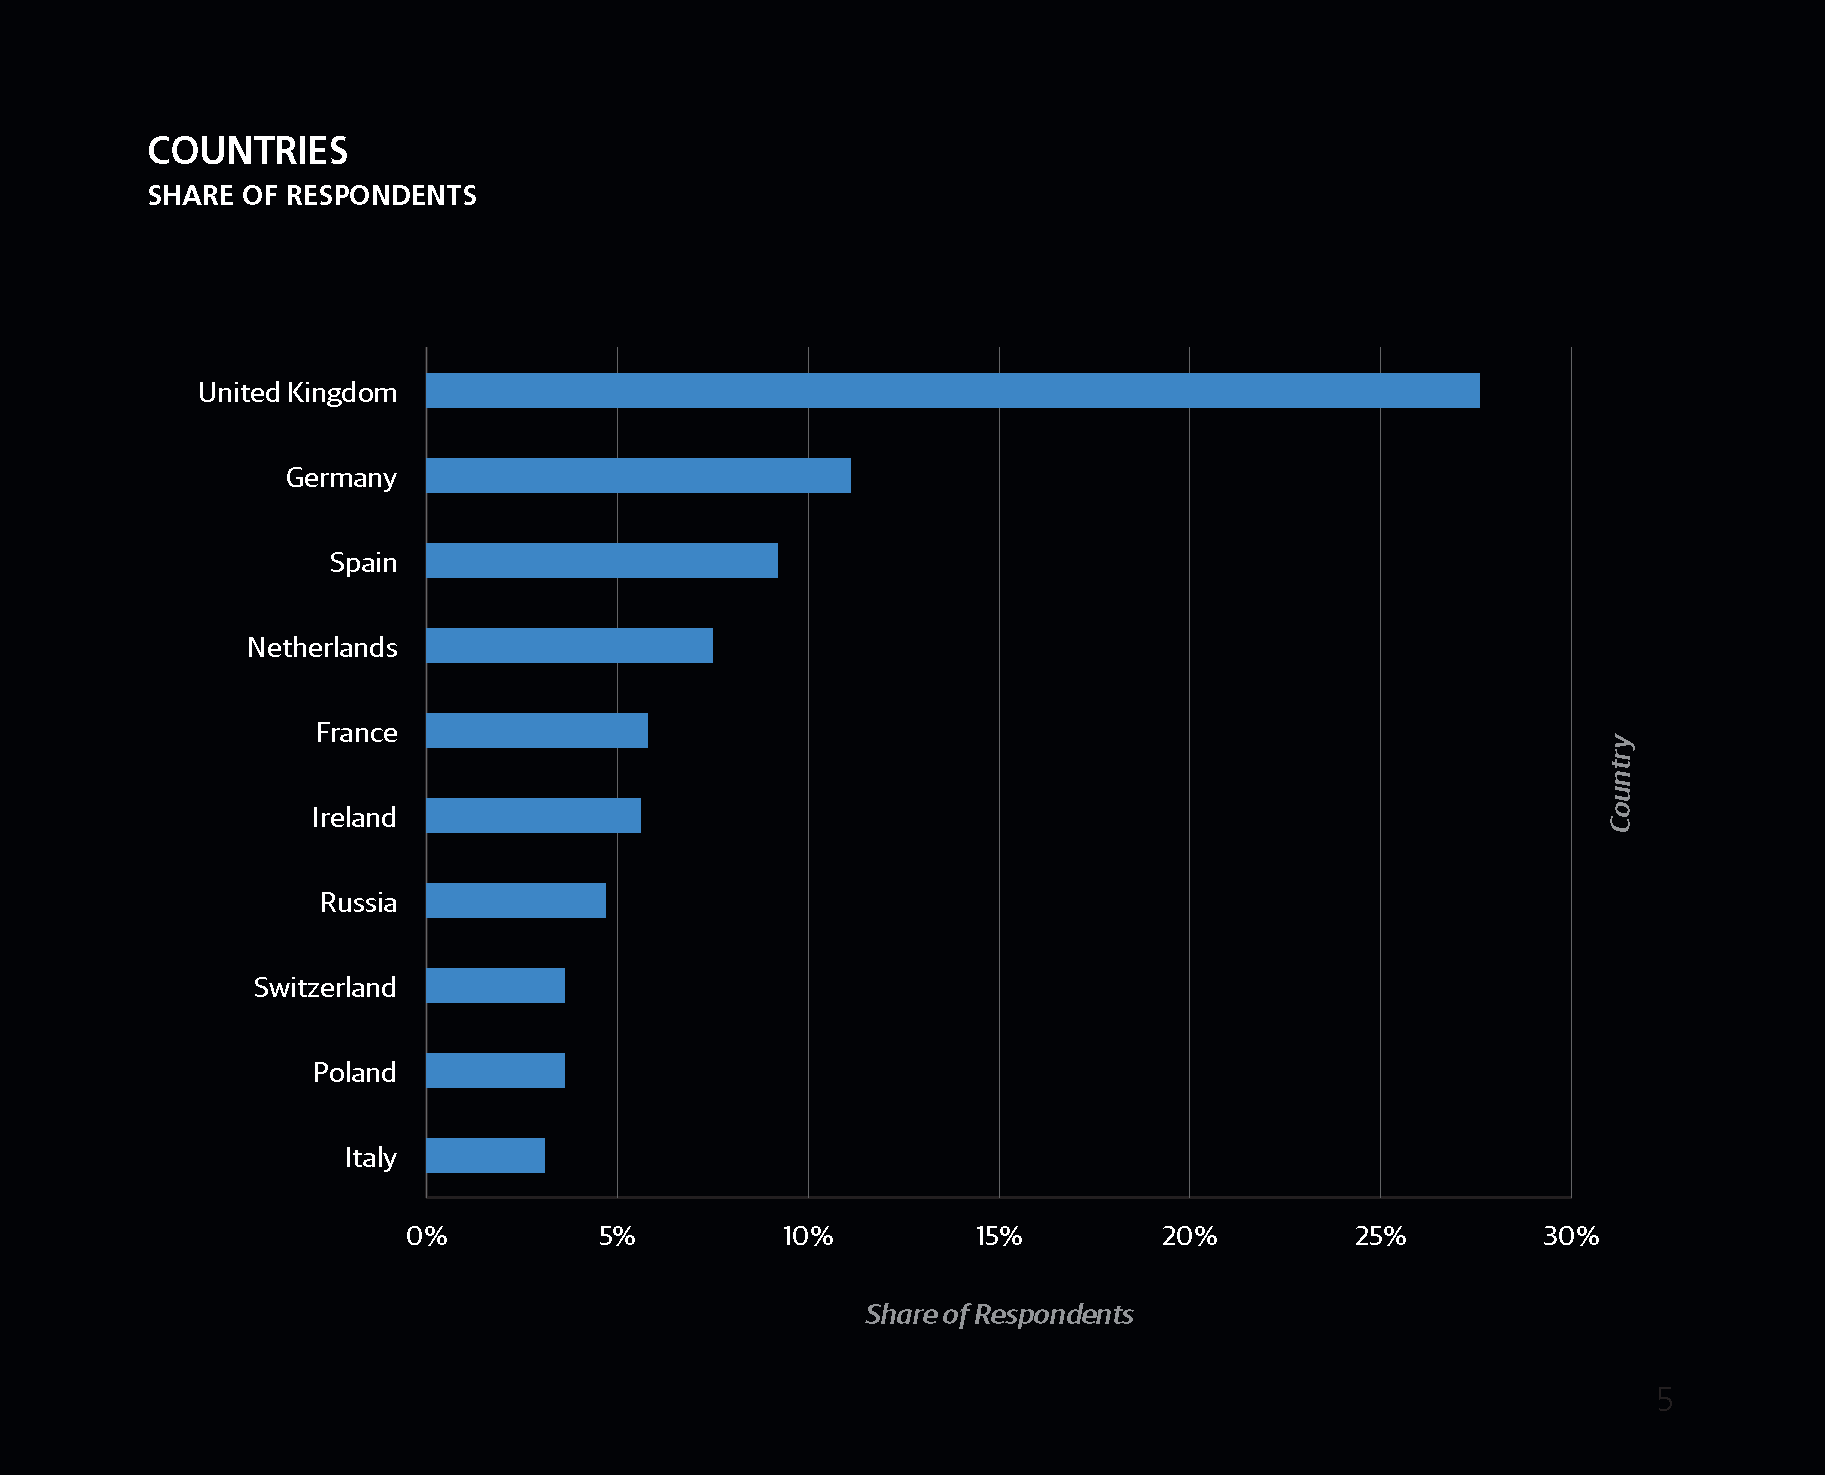
THE UK WAS THE MOST WELL-REPRESENTED EUROPEAN
COUNTRY, with about a quarter of the sample, followed
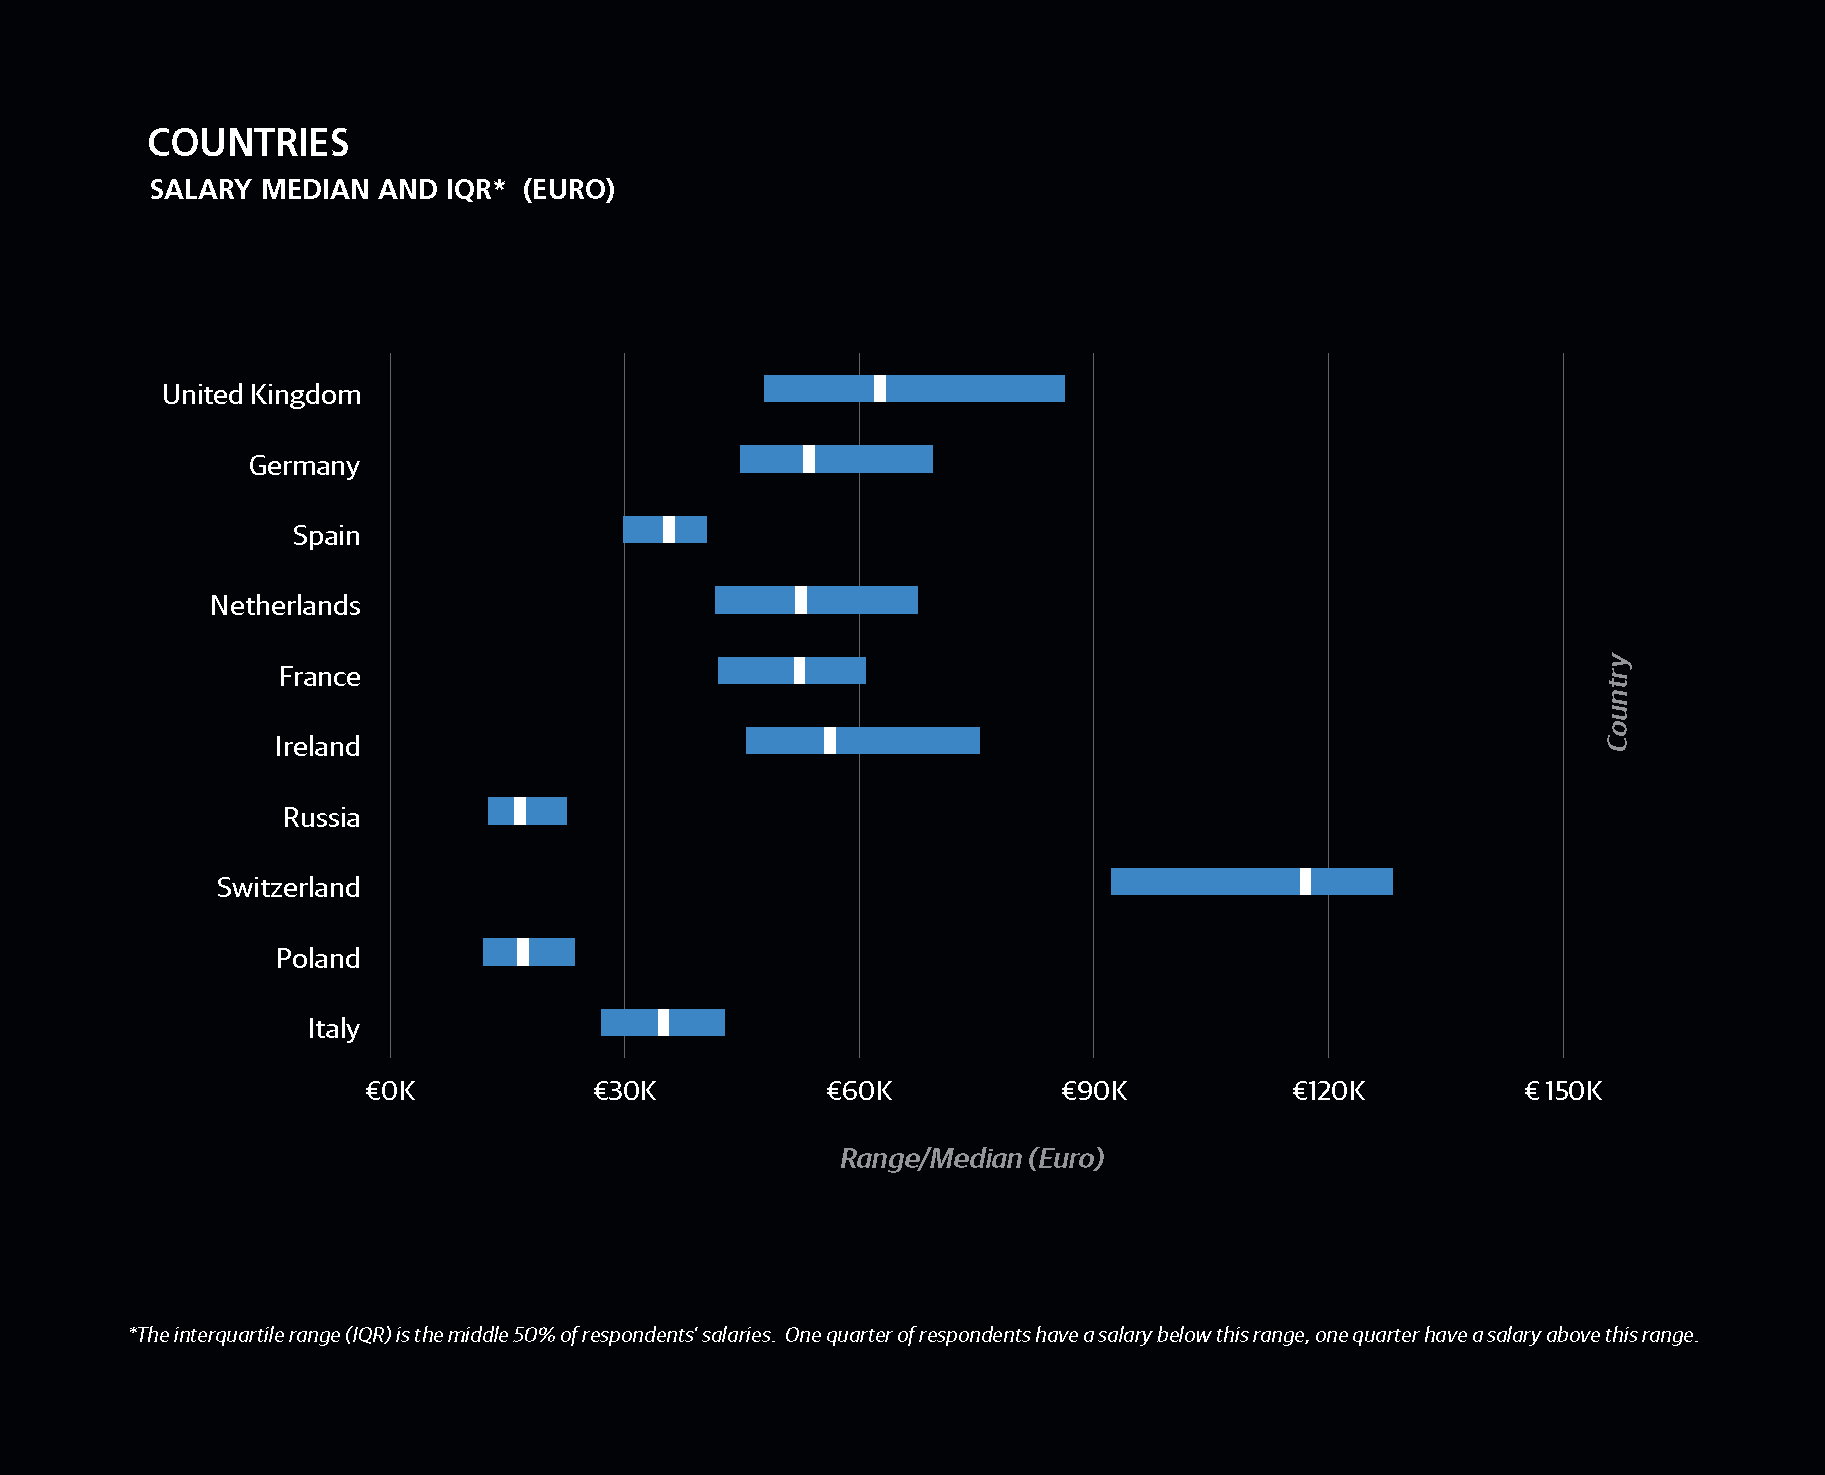
by Germany, Spain, and the Netherlands. By far, the highest
salaries were in Switzerland, with
a median salary of €117K, followed
by Norway with €96K, although
the latter figure is only based on
five respondents. Among countries
represented by more than just a
handful of respondents, the UK had
the second-highest median salary:
€63k (£53).
Even within Western Europe, there was significant variation
in salary. While UK, Swiss, and Scandinavian salaries were
significantly higher than the Western European median of €54K, Spanish and Italian respondents tended to have much
lower salaries (€35K). Portugal was somewhat of an outlier in
Western Europe, with a median of €22K. The median salaries
of Germany, the Netherlands, and
France were close to the regional
median (about €53K).
Salaries drop dramatically as we
move south and east. The median
salary of respondents from Central
and Eastern Europe was €17K. Russia
and Poland, the two most well-represented
countries in this half of the
continent, also had median salaries of €17K: unlike in the west,
Eastern European salaries appeared to be fairly consistent,
even across national borders.
Note
Unlike in the west, Eastern
European salaries appeared
to be fairly consistent, even
across national borders.
Salary Versus GDP
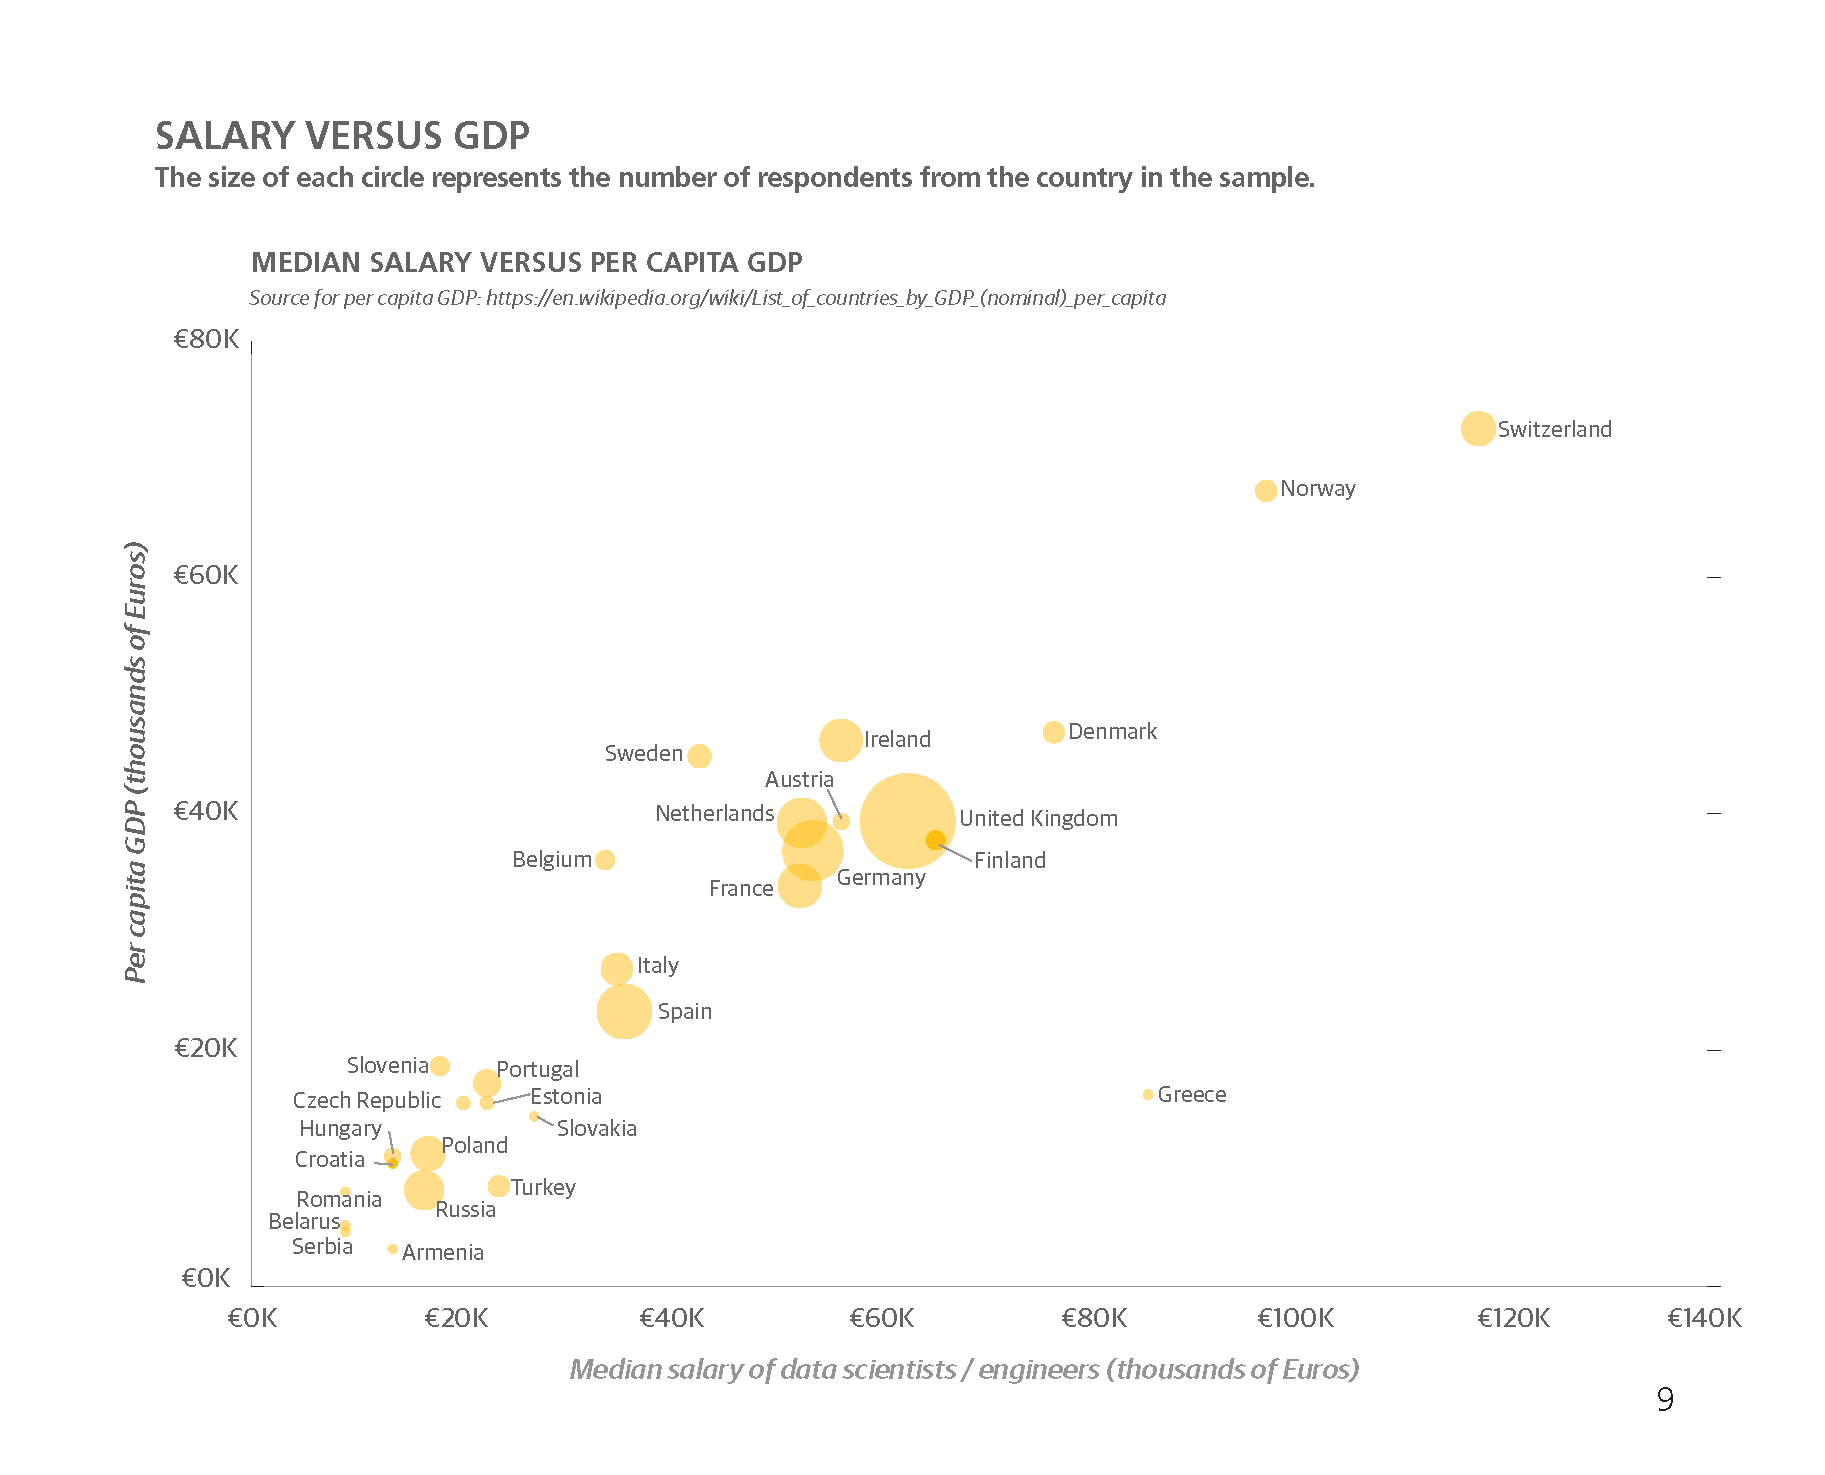
NATIONAL MEDIAN SALARIES SHOULD BE EXPECTED
TO VARY according to the economic
conditions of the country, so the
question becomes: given a country’s
economy (in particular, its per capita
GDP), do the salaries of data scientists
and engineers vary? Here, we plot per
capita GDP and median salary of each
country in the sample. The resulting
graph is remarkably linear, with outliers
largely explained by small sample size:
Greece, for example, has a higher-
than-expected median salary given a
relatively low per capita GDP, but this is
based on just one respondent.
One shortcoming of this plot is that it does not take into account
years of experience, which turns
out to be very uneven in the sample
among different countries. In particular,
respondents from Western Europe
tended to be much more experienced
(with an average of seven years) than
respondents from Eastern Europe
(with an average of four years).
Since experience correlates with salary,
the West-East salary difference is
exaggerated due to this experience
differential.
Note
The question becomes, given a country’s economy (in particular, its per capita GDP), do the salaries of data scientists and engineers vary?
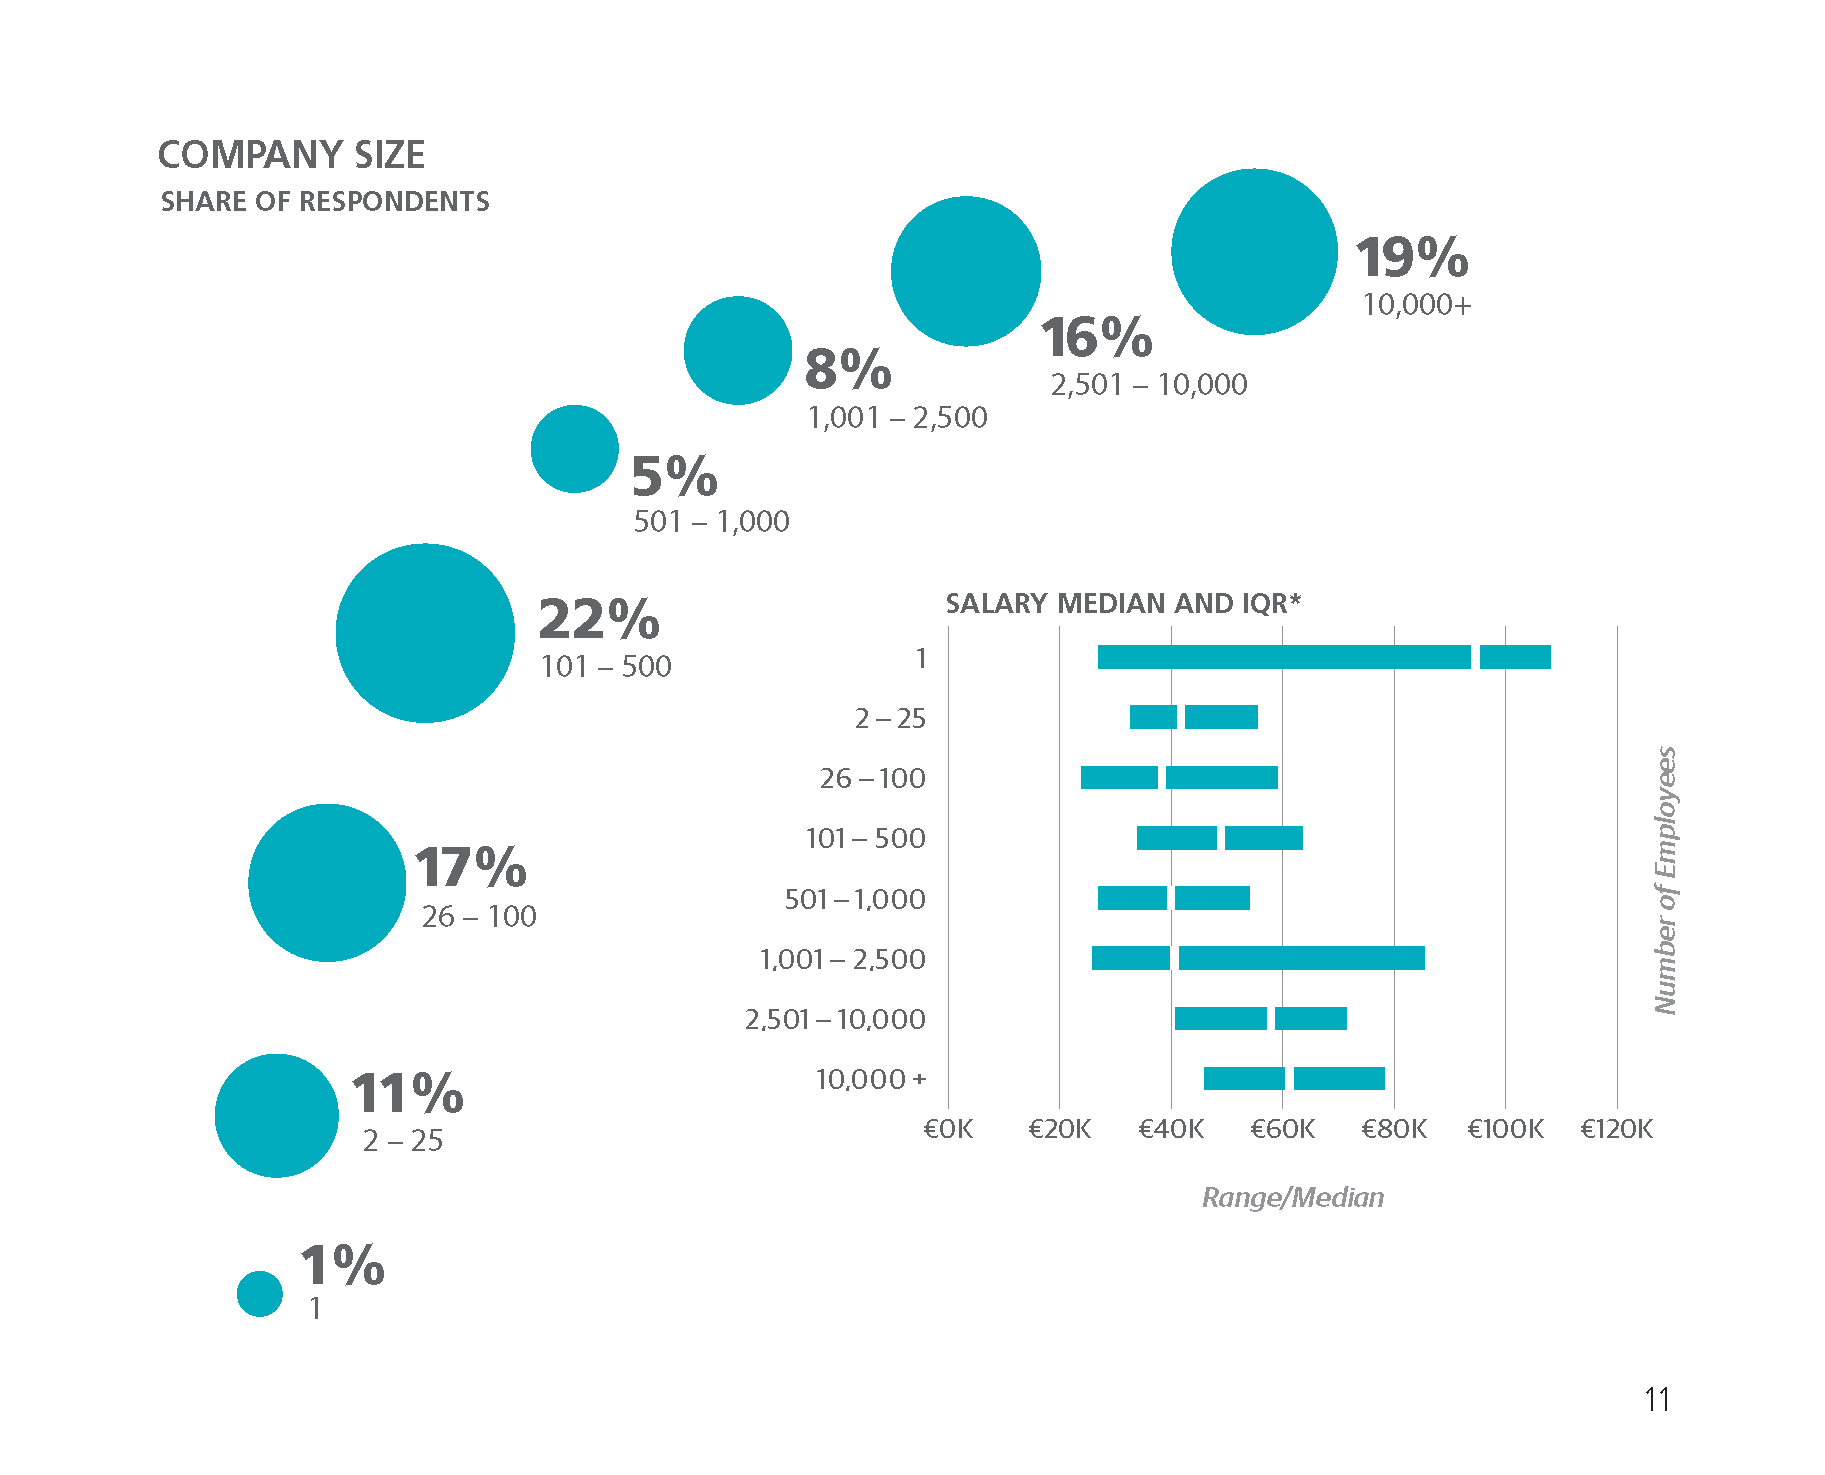
Company Size
COMPARED TO THE WORLDWIDE SAMPLE, THE
SUBSAMPLE FROM EUROPE TENDED TO COME FROM
SMALLER COMPANIES. While 45% of US respondents were
from companies with over 2,500 employees, only 35% of
European respondents were from such companies. This number
rises to 39% if we consider only those from Western Europe;
only 13% of respondents from Central/Eastern Europe were
from large companies.
Largely because of the East-West split, salaries at larger companies
tend to be high: the 19% of respondents from companies
with over 10,000 employees had a median salary of €61K.
In contrast, the half of the sample that was from companies
with 2 to 500 employees had a median salary of €43K.
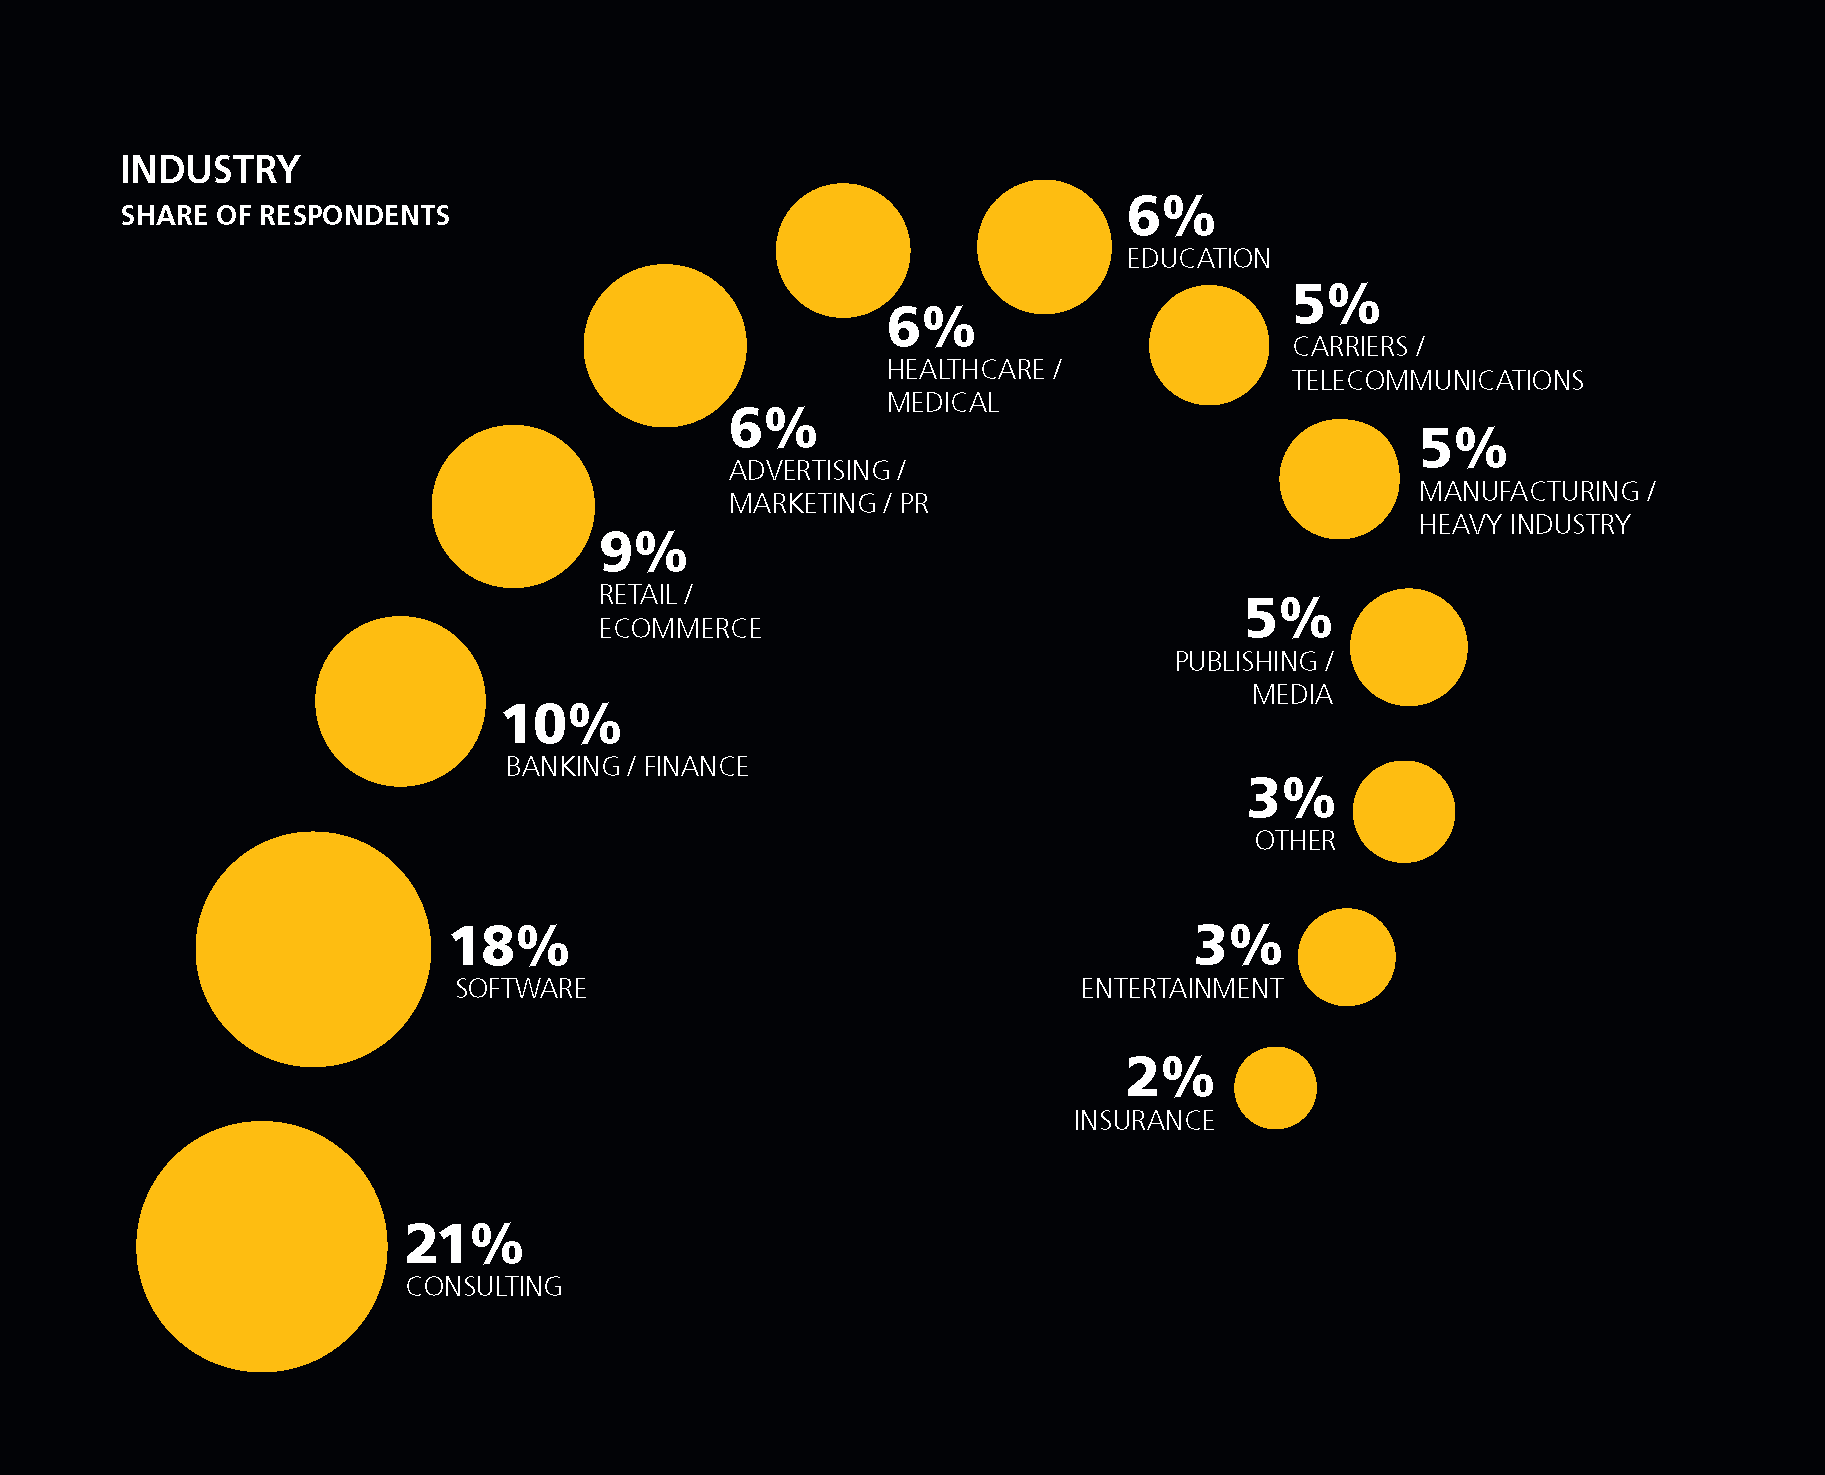
Industry
A PLURALITY OF RESPONDENTS (20%) WORKED IN
CONSULTING, after which the top industries were software
(18%), banking/finance (10%), and retail/ecommerce (9%).
These figures are very similar to those of the worldwide
sample.
As with company size, the differences in salaries among industries
was largely attributable to geography. Manufacturing,
insurance, and publishing/media were all overrepresented by
countries with higher salaries. One exception to this was banking/
finance, which had a high median salary of €58K and did
not correlate with a particular country or region: data professionals
in banking do appear to earn more.
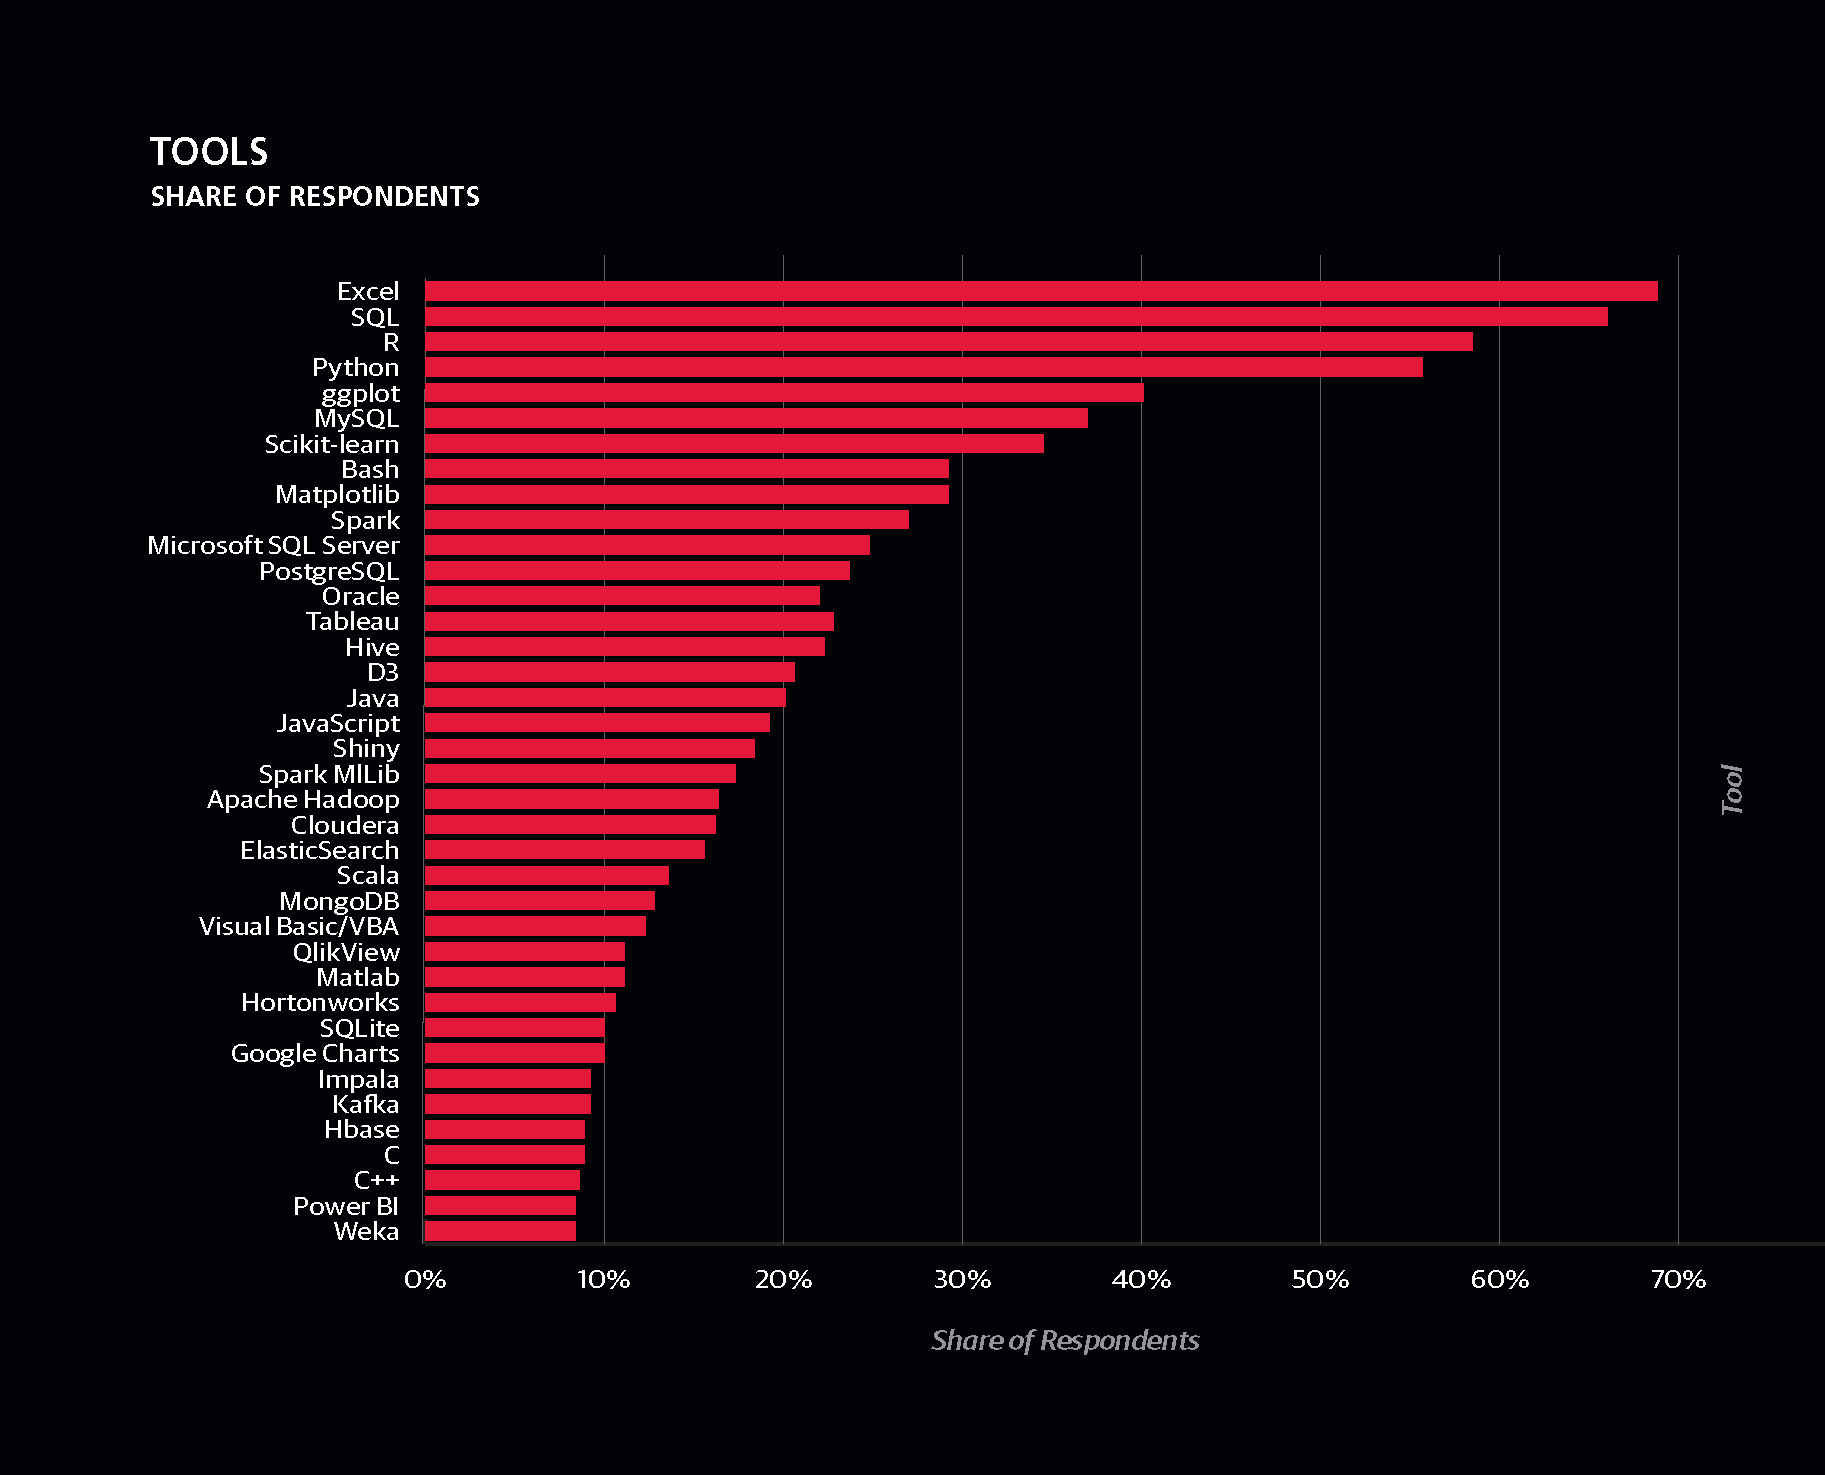
Tools
THE TOP FOUR TOOLS FROM EUROPEAN RESPONDENTS WERE EXCEL, SQL, R, AND PYTHON, each used by over half of all respondents. These four tools have kept their top positions in every Data Salary Survey we have conducted, and there does not appear to be any sign of this changing. Almost every respondent reported using at least one, and about half the sample used three or all four.
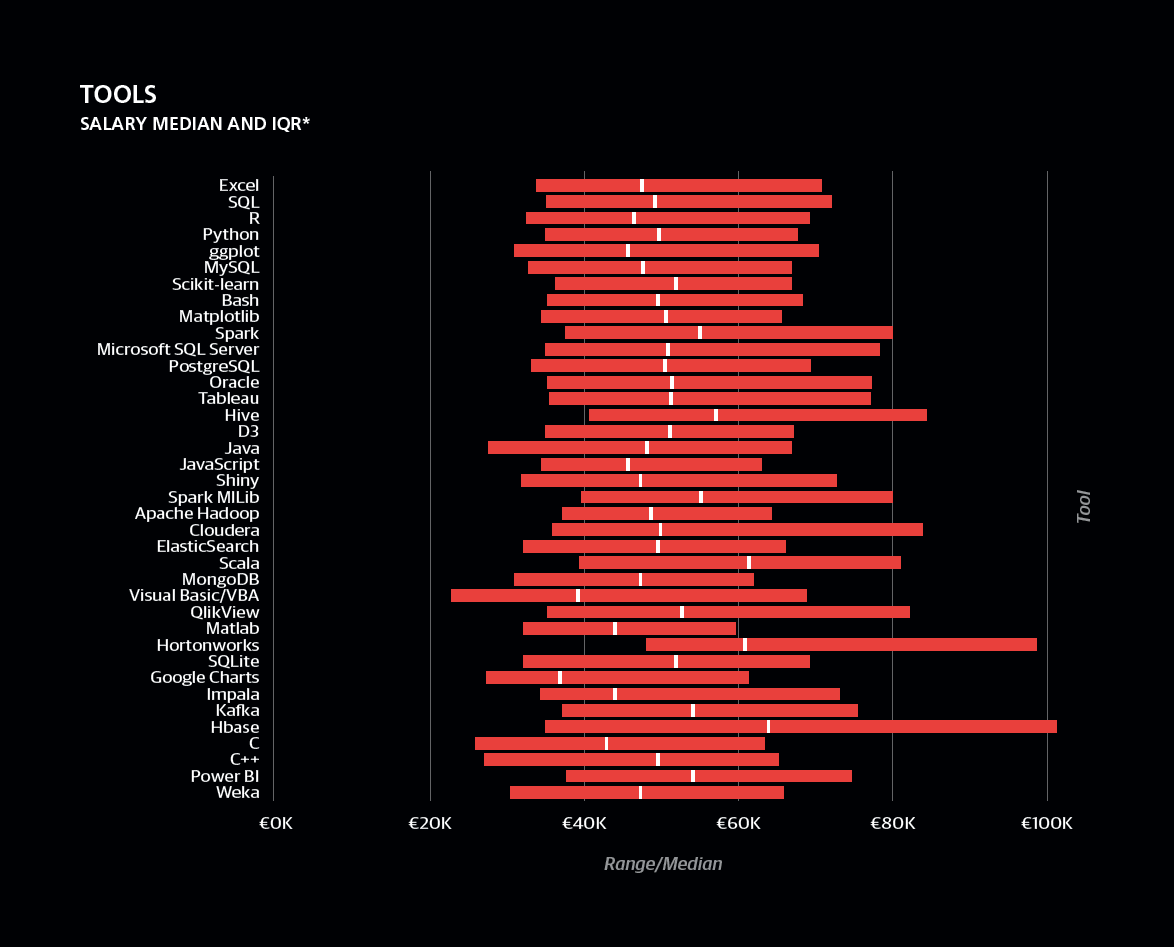
Commonly used tools with above-average salaries include Scikit-learn (whose users have a median salary of €52K), Spark (€55K), Hive (€57K), and Scala (€70K). Readers may notice that most tools have a higher median salary than
the sample-wide median salary of €48K. This is because respondents who use lots of tools tend to earn more (and they are counted in a large number of tool salary medians). The 43% of respondents who used no more than 10 tools had a median salary of €43K, while those who used more than 10 tools had a median salary of €53K.
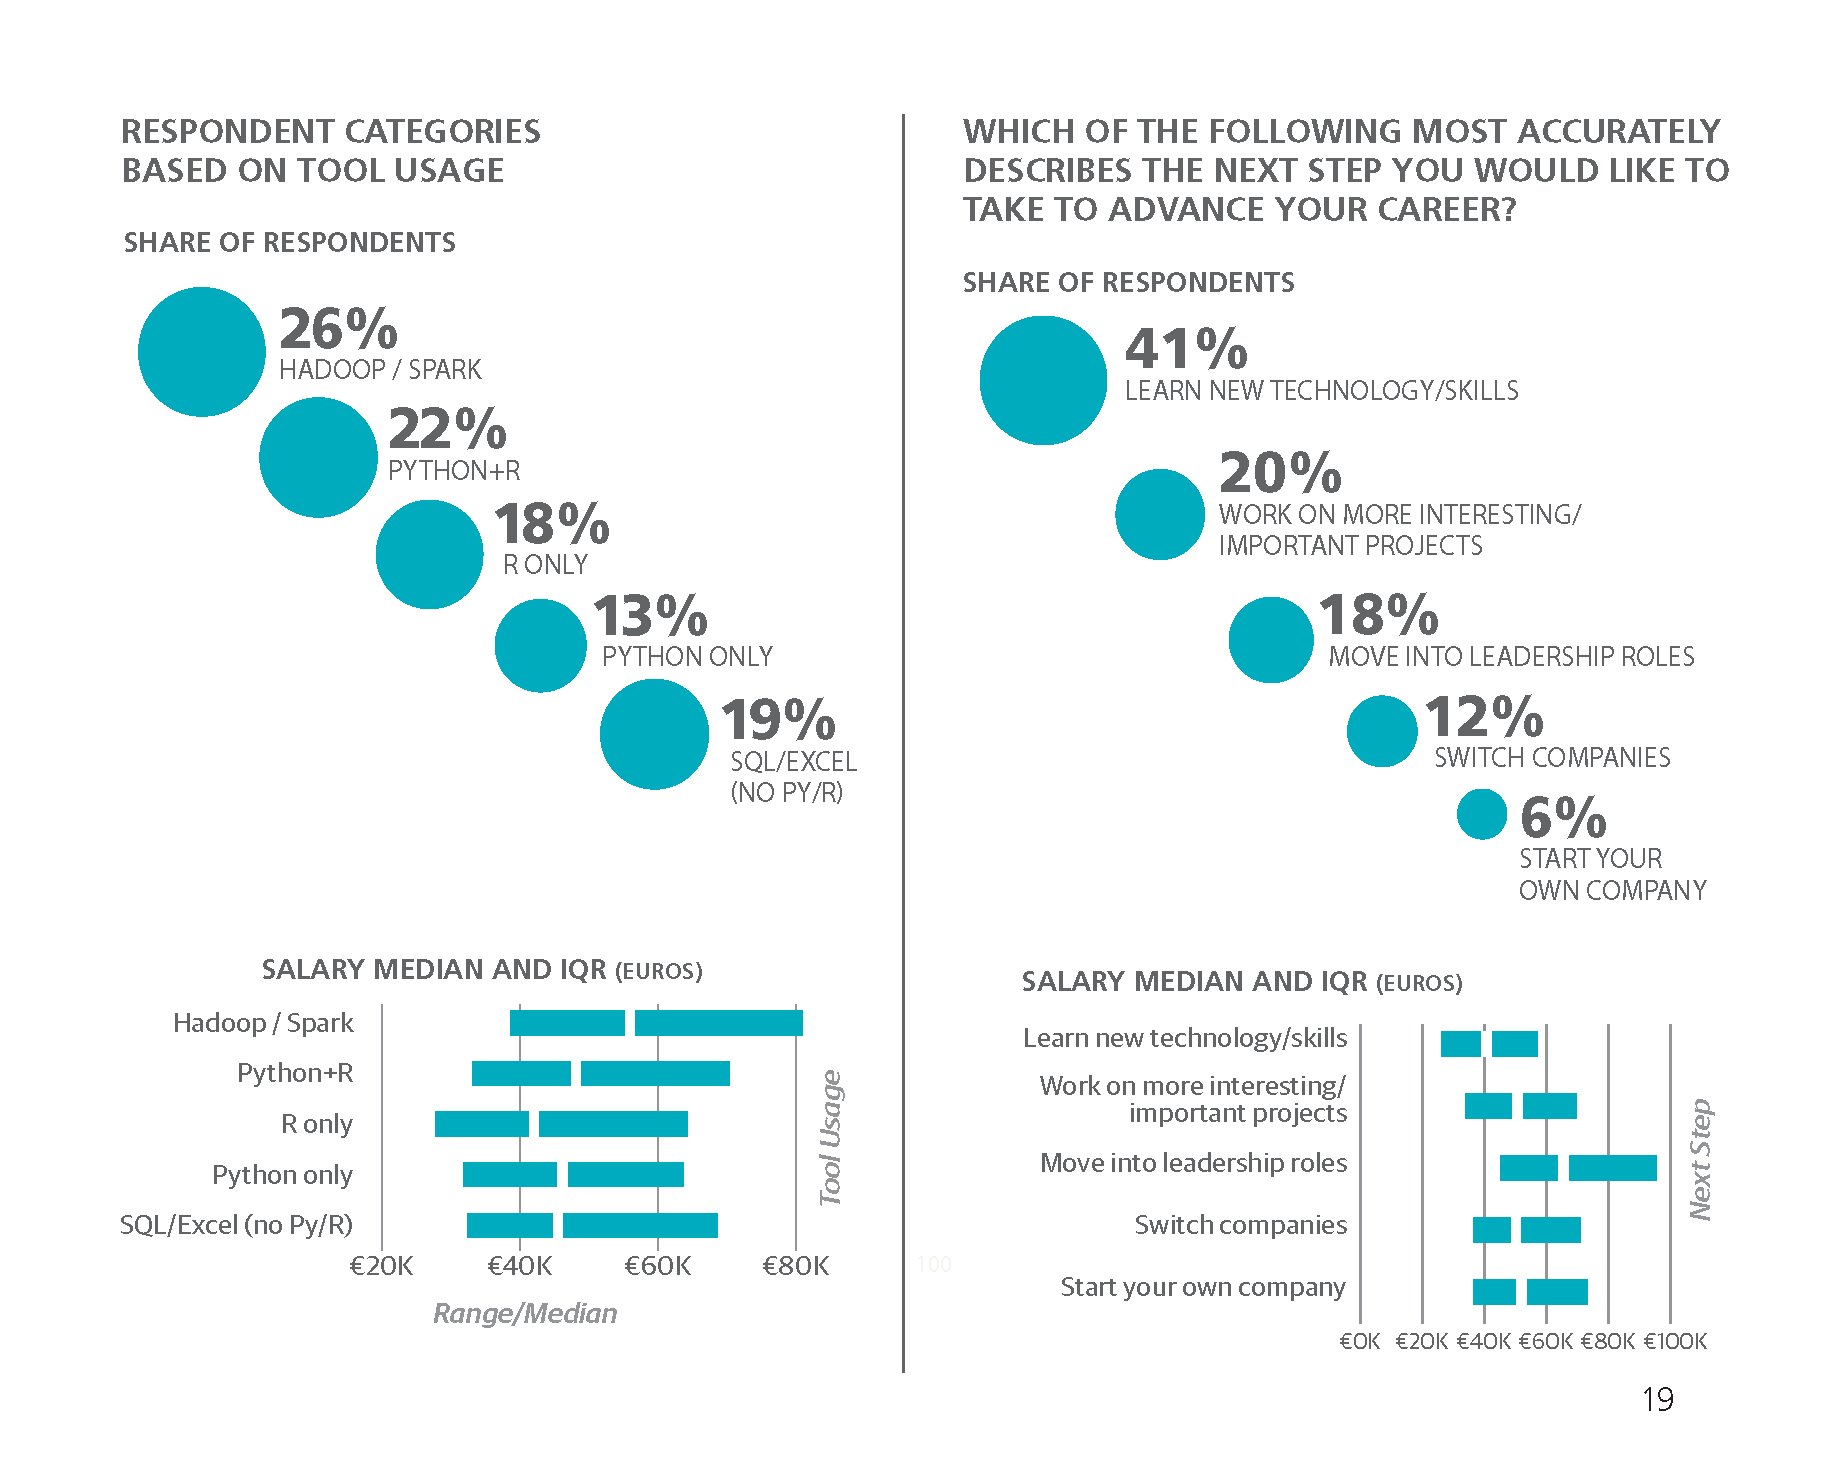
Since there is significant overlap between users of individual tools, it is useful to consider mutually exclusive groups of respondents based on tool usage. The groups we will define here are based on a simple set of rules, but using a clustering algorithm would produce very
similar results. The rules are:
If someone used Spark or Hadoop, we call them “Hadoop”
If someone (not in the Hadoop group) uses R and/or Python, they are labeled “R+Python,” “R-only,” or “Python-only,,” as appropriate
Everyone who uses SQL and/or Excel (usually both), we call “SQL/Excel”
The five resulting groups each contain between 13%
and 26% of the sample. The Hadoop group reported the
highest salaries (median: €56K), while the R-only group
had the lowest (€42K). However, this doesn’t mean that
knowing R means less pay: respondents using Python and
R earned slightly more than those using Python and not R.
Aside from salary, one important difference between the
groups is experience. The SQL/Excel group—in other words,
those who don’t use Python, R, Spark, or Hadoop—was more
experienced than the other groups (8.3 years on average),
followed by the R-only (7.3 years), Hadoop (6.3 years),
Python-only (6 years), and Python+R groups (5.2 years).
Since we expect more-experienced data professionals to earn
higher salaries, the median salary of €46K for the SQL/Excel
group is actually quite low, while the €48K of the Python-R
group is high.
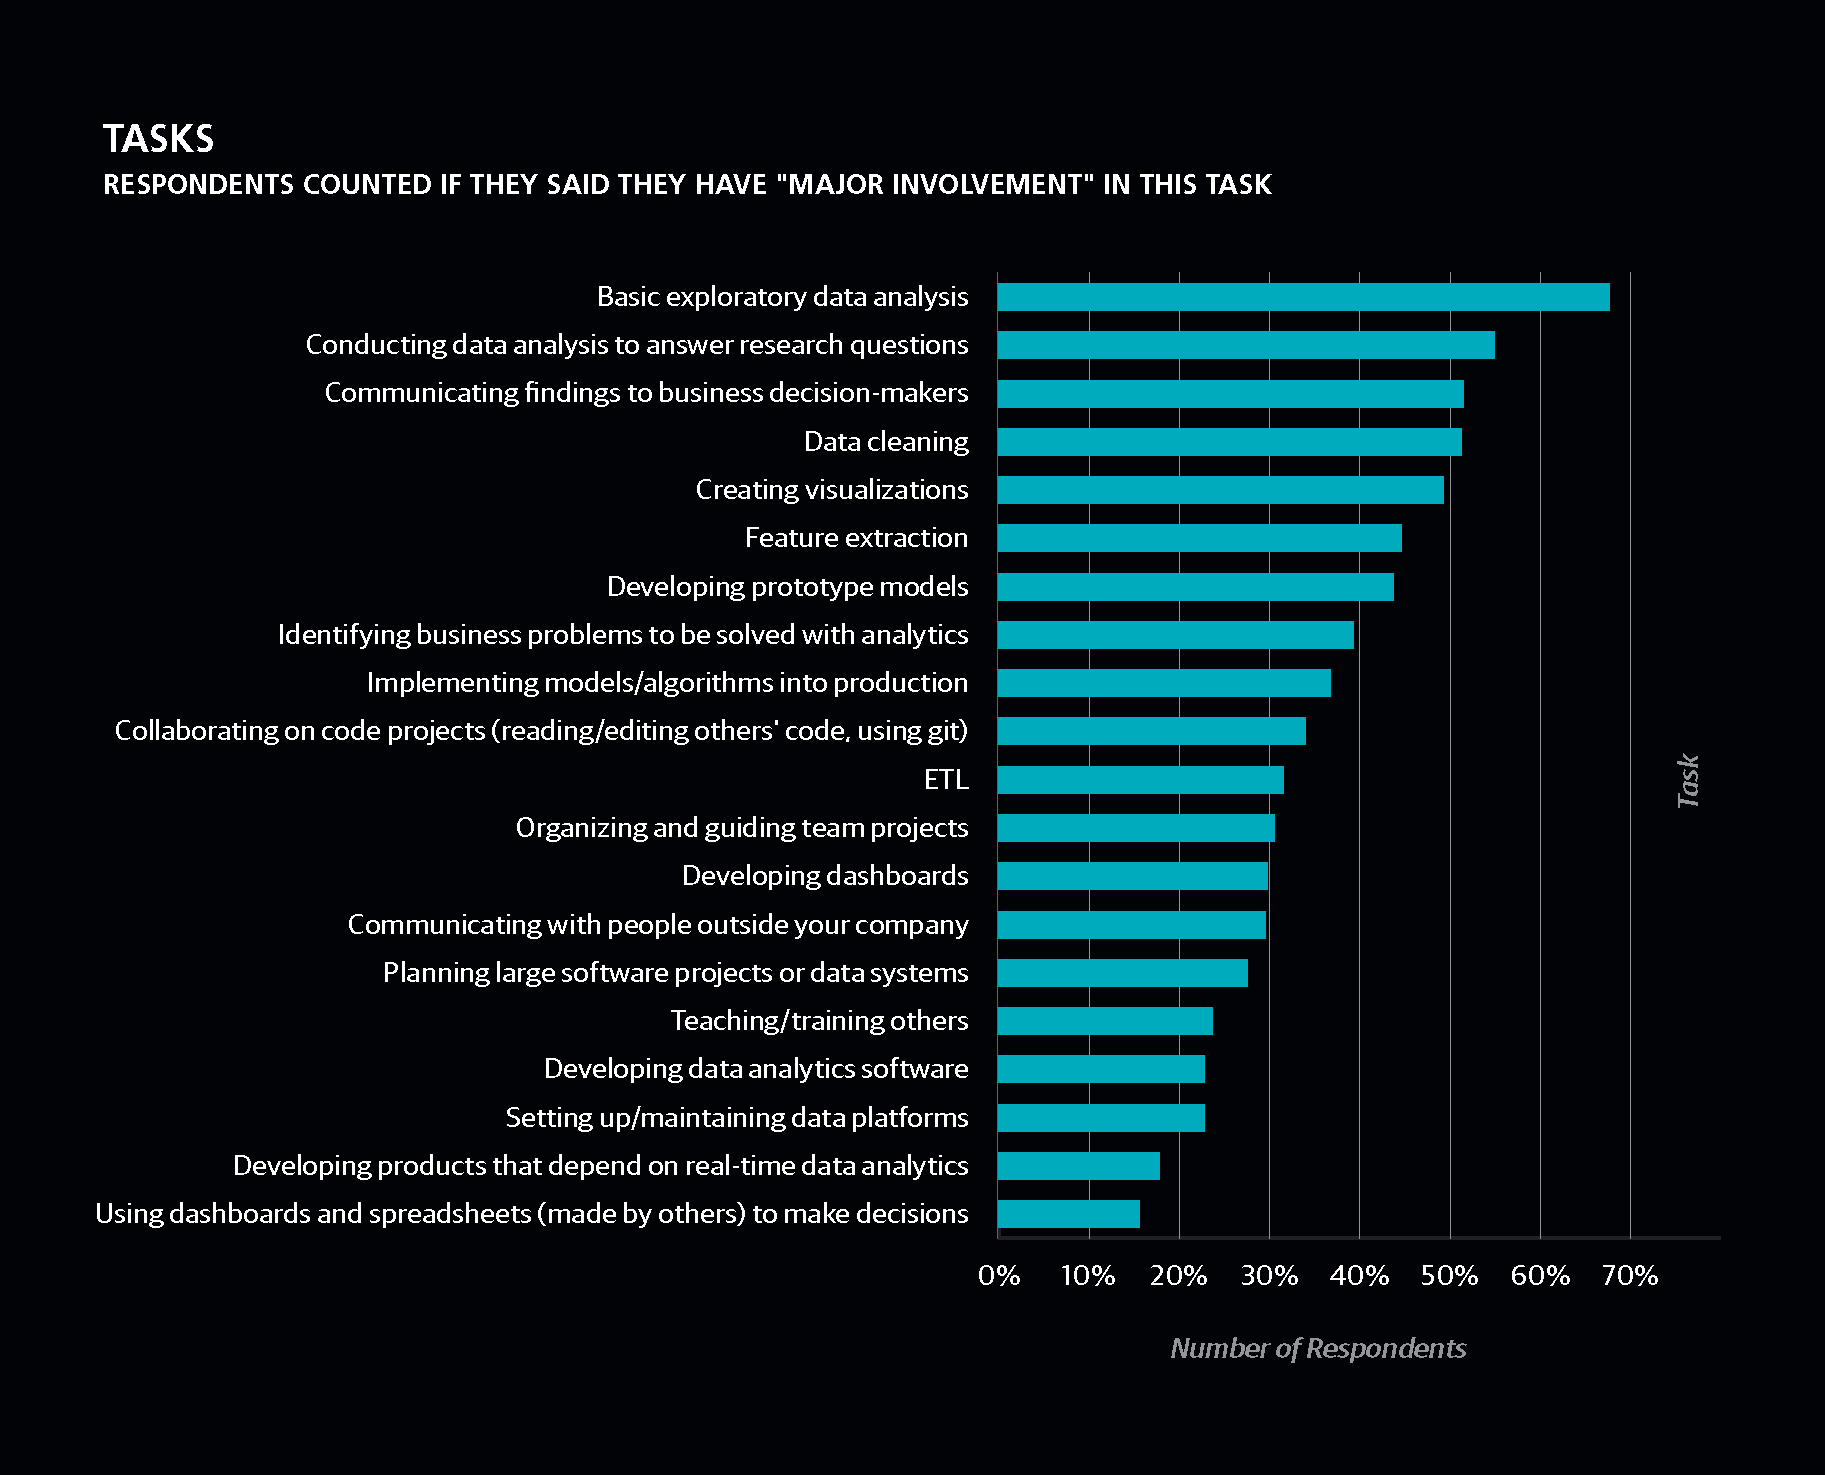
Tasks
WE ALSO ASKED FOR INFORMATION ABOUT WORK
TASKS: this is meant to dig a little deeper than what we
can glean from a job title. Respondents could say they had
“major” or “minor” involvement in each task. For the most
part, tasks that correlate positively with salary also correlate
positively with years of experience
(and often are clearly associated
with being a manager).
Among the most common
tasks were “basic exploratory
data analysis,” “data cleaning,”
“creating visualizations,” and
“conducting data analysis to
answer research questions,” each
with 85%–93% of the sample
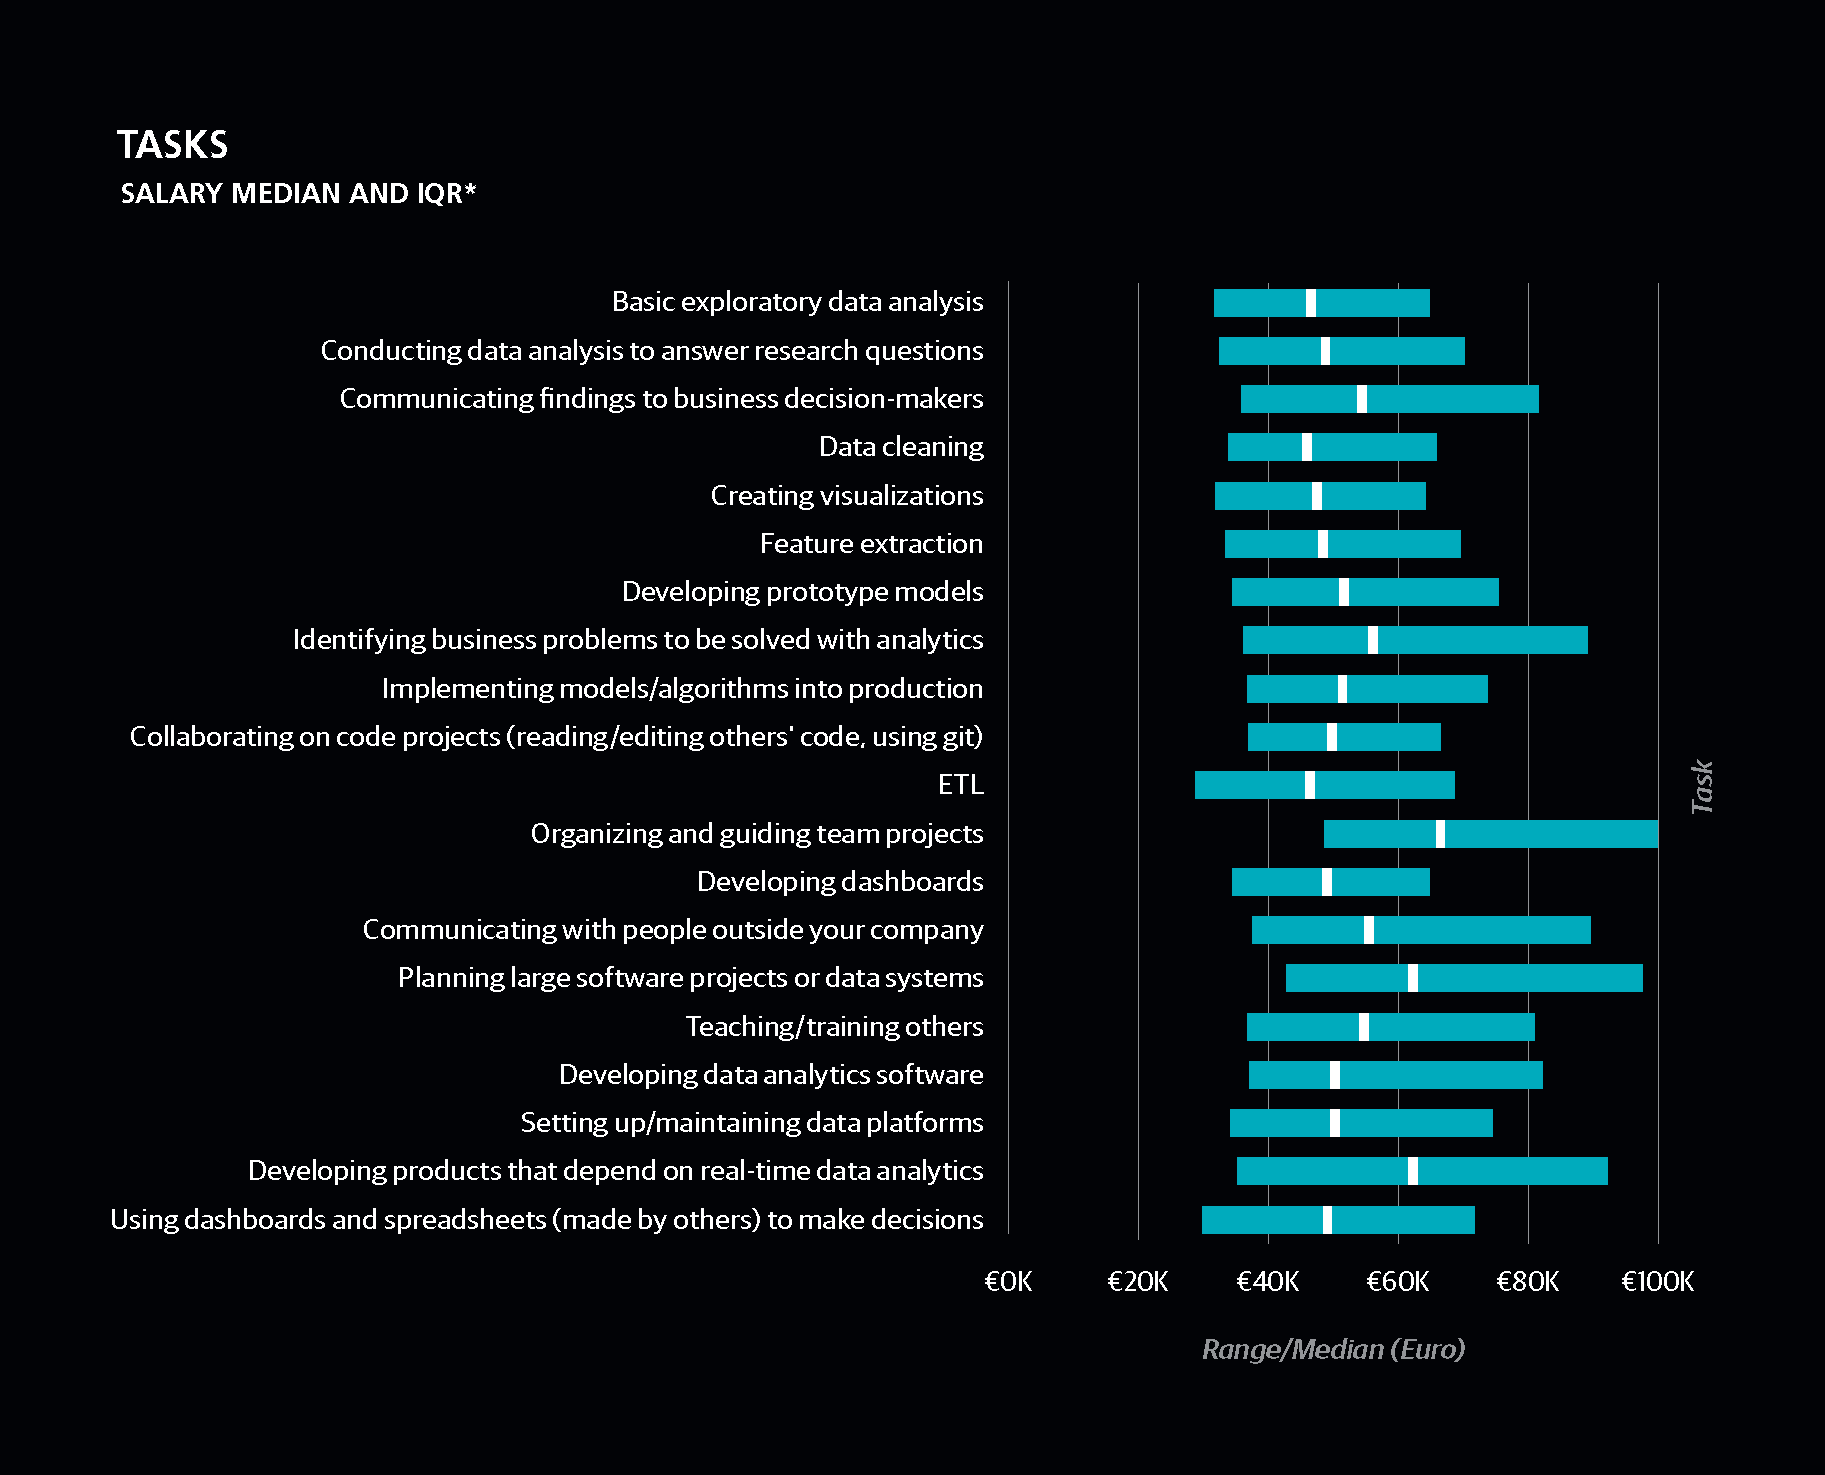
as a major or minor task. Data cleaning has the unfavorable
distinction of being the only task for which each level of
involvement means less pay: those with major involvement
earn less than those with minor involvement, who in turn
earn less than those who never clean data. However, this may
have more to do with the fact that more-experienced data
professionals (who we know earn more) tend to do less data
cleaning.
Tasks that correlate most strongly with high salaries are
those that involve management and business decisions, such
as “communicating findings to business decision-makers,”
“identifying business problems to be solved with analytics,”
“organizing and guiding team projects,” and “communicating
with people outside of your
company”. The median salaries
of respondents who reported
major involvement in these tasks
were €54K, €56K, €66K, and
€55K, respectively.
Aside from management and
business strategy, several
technical tasks stood out for
above-average salaries:
“developing prototype models” (major involvement: €52K),
“setting up/maintaining data platforms” (€50K), and
“developing products that depend on real-time analytics”
(€62K). For each of these tasks, respondents who reported
major involvement earned more than those who reported
minor involvement, and those who reported minor
involvement earned more than those who did not
engage in these tasks at all.
Note
Tasks that correlate most
strongly with high salaries are
those that involve management
and business decisions.
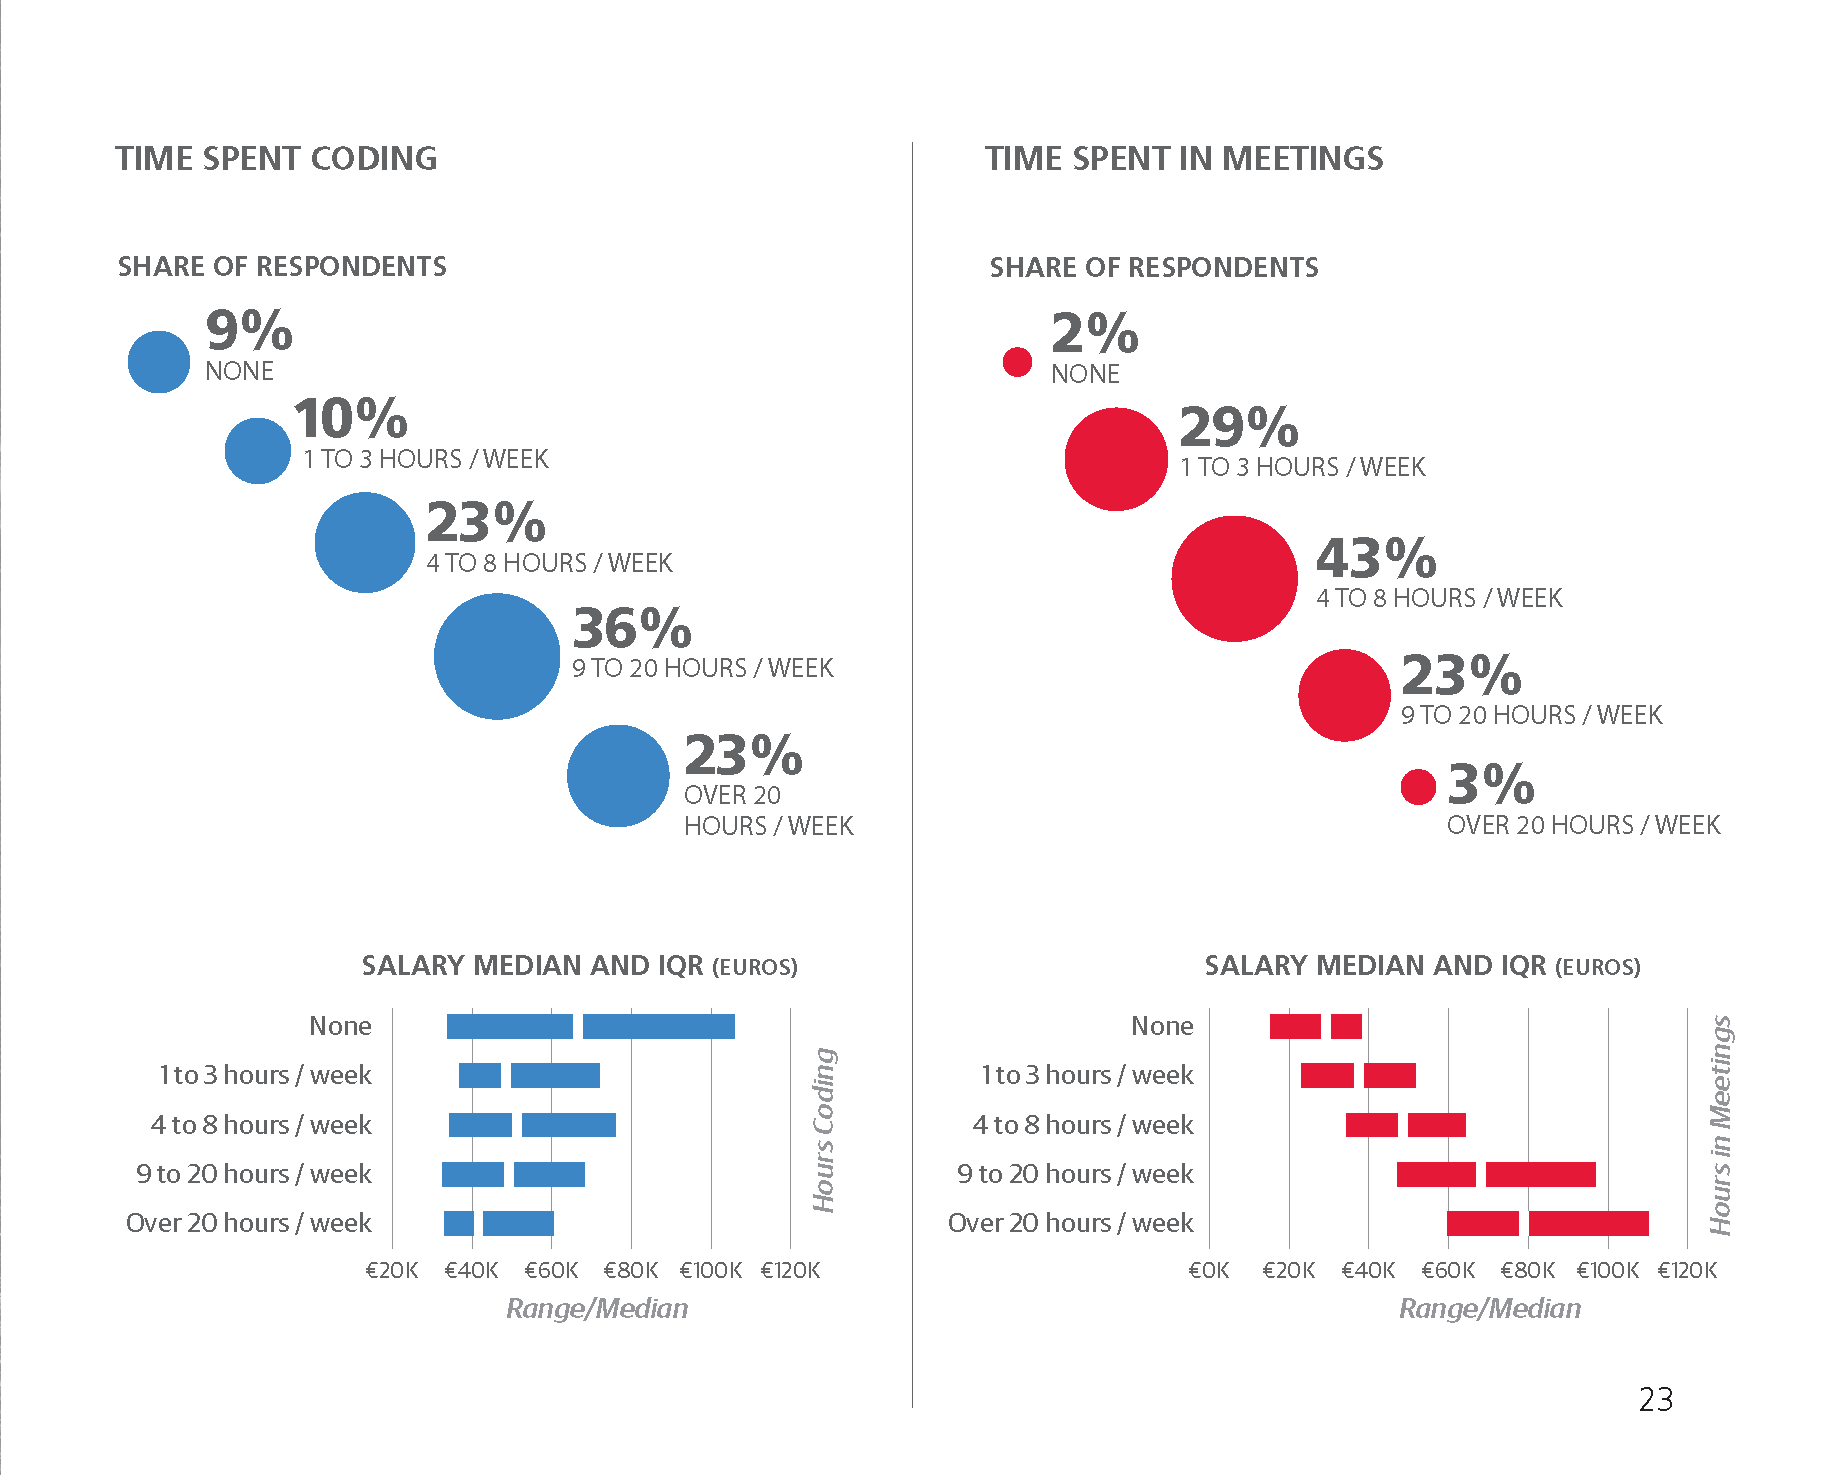
Coding and Meetings
FOR TWO BROADER TASKS, coding and attending meetings,
we asked respondents for more detail: namely, how much time
they spend on them. As we have consistently seen, attending
meetings correlates with salary: respondents who spend over
20 hours per week in meetings earn more than those who spend
9–20 hours, who in turn earn more than those whose spend
4–8 hours per week in meetings, and so on. This is unlikely to
be a direct causal relationship, but rather both are effects of a
shared cause (such as working in management).
As for coding, the highest earners were those who don’t code
at all, but that’s because they tended to be managers. There is
a dip in salaries among respondents who code over 20 hours
per week, but this is explained by the fact that this group
was, on average, less experienced than the rest of the sample.
Within the middle groups—those who code 1–20 hours per
week—there was not much variation in pay.
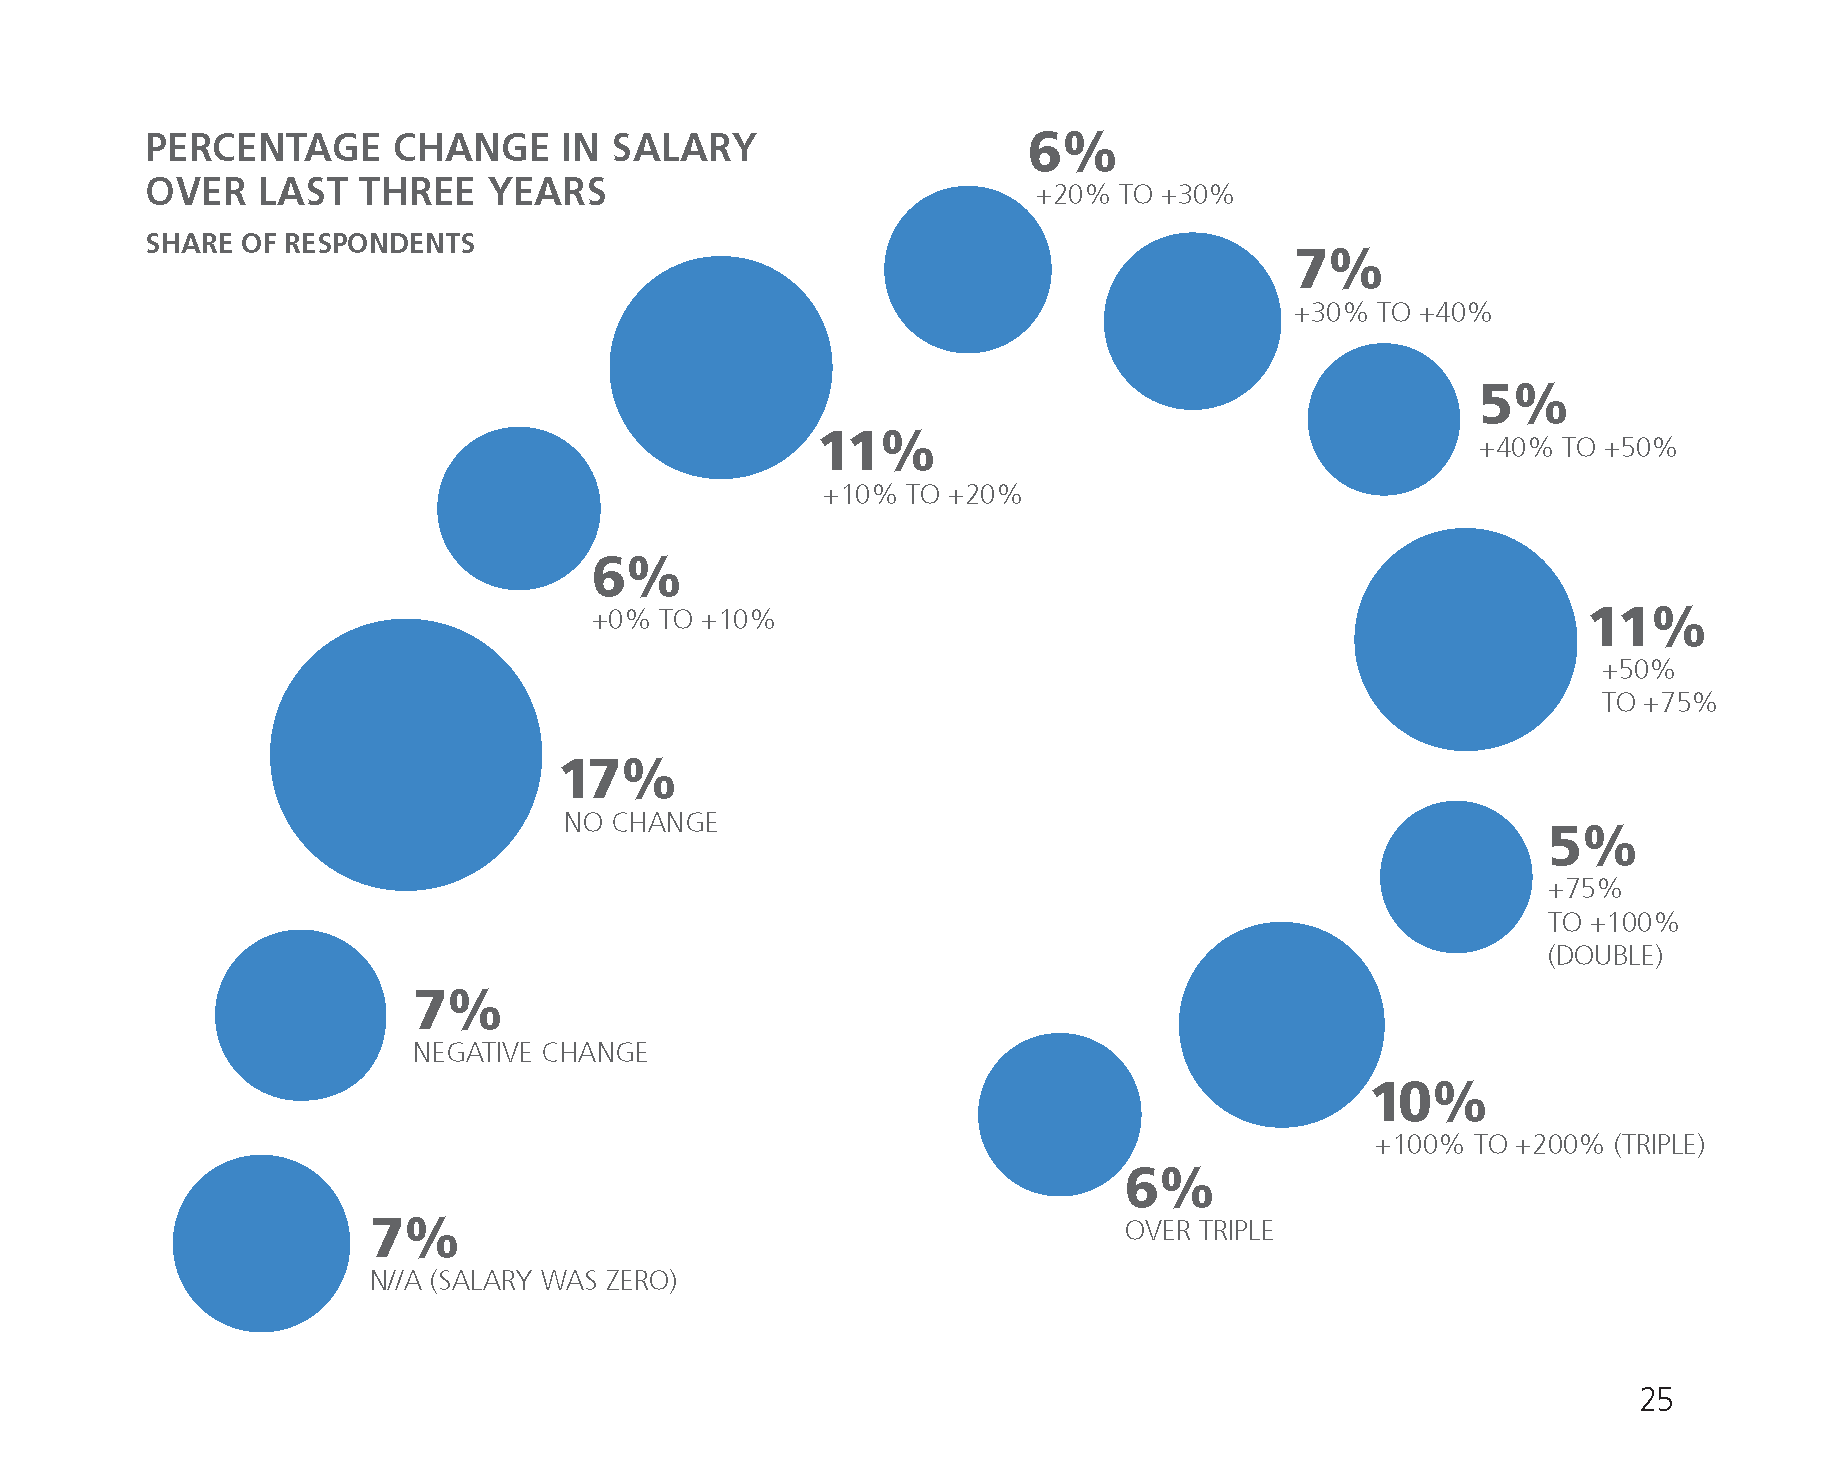
Salary Change
AN ALTERNATIVE METRIC TO CURRENT SALARY is the
amount that one’s salary changed in the last three years. Most
respondents’ salaries grew at least a little in the last three years,
and about a third of the sample saw
their wages rise by 50% or more over
this period. This latter group tended to
be less experienced, with an average of
4.4 years of experience (compared to
7.6 years among those whose salaries
did not grow by 50% or more).
For Spark/Hadoop and Python-only
users, we use the tool-defined groups from page 8. They
were most likely to have had 50% or more wage growth
(40% and 44% of them did, respectively). Respondents who
did not use Hadoop, Python, or R (the “SQL/Excel” group)
were the least likely: only 19% of them reported a 50% rise
in their salaries.
A final question asked respondents about the next step they
would like to take in their career. The top response was “learn
new technology/skills” and respondents who gave this answer
tended to be less experienced (5.5
years on average) and have smaller
salaries (€40K median) than the rest
of the sample.
Respondents who said they would
like to move into leadership roles
had salaries far above average
(€65K median). The other top
responses were “work on more interesting/important
projects,” “switch companies,” and “start your own
company”. Respondents who work in the healthcare
industry were far more likely to choose “switch companies”
(33%) than respondents from other industries (11%).
Note
Most respondents’ salaries
grew at least a little in the
last three years
Conclusion
THE PURPOSE OF OUR SALARY SURVEYS and the
reports based on them is to provide an annual, data-driven
snapshot of how much professionals in your field make,
and to expose details of their
work and career. There are
plenty of resources out there
that can give an idea of how
much a data scientist can
expect to earn or which
software tools are on the rise,
but there aren’t many places
where these data points are
integrated into one report.
This information isn’t just for employees, either. Business
leaders choosing technologies need to consider not just the software costs, but labor expenses as well. We hope that
the information in this report will aid the task of building
estimates for such decisions.
If you made use of this report,
please consider taking the online
survey. Every year, we work to
build on the last year’s report,
and much of the improvement
comes from increased sample
sizes. This is a joint research
effort, and the more interaction
we have with you, the deeper
we will be able to explore the data science space in Europe.
Thank you!
Note
Business leaders choosing
technologies need to consider
not just the software costs, but
labor expenses as well.