AI Adoption in the Enterprise 2021

During the first weeks of February, we asked recipients of our Data and AI Newsletters to participate in a survey on AI adoption in the enterprise. We were interested in answering two questions. First, we wanted to understand how the use of AI grew in the past year. We were also interested in the practice of AI: how developers work, what techniques and tools they use, what their concerns are, and what development practices are in place.
The most striking result is the sheer number of respondents. In our 2020 survey, which reached the same audience, we had 1,239 responses. This year, we had a total of 5,154. After eliminating 1,580 respondents who didn’t complete the survey, we’re left with 3,574 responses—almost three times as many as last year. It’s possible that pandemic-induced boredom led more people to respond, but we doubt it. Whether they’re putting products into production or just kicking the tires, more people are using AI than ever before.

Learn faster. Dig deeper. See farther.
Executive Summary
- We had almost three times as many responses as last year, with similar efforts at promotion. More people are working with AI.
- In the past, company culture has been the most significant barrier to AI adoption. While it’s still an issue, culture has dropped to fourth place.
- This year, the most significant barrier to AI adoption is the lack of skilled people and the difficulty of hiring. That shortage has been predicted for several years; we’re finally seeing it.
- The second-most significant barrier was the availability of quality data. That realization is a sign that the field is growing up.
- The percentage of respondents reporting “mature” practices has been roughly the same for the last few years. That isn’t surprising, given the increase in the number of respondents: we suspect many organizations are just beginning their AI projects.
- The retail industry sector has the highest percentage of mature practices; education has the lowest. But education also had the highest percentage of respondents who were “considering” AI.
- Relatively few respondents are using version control for data and models. Tools for versioning data and models are still immature, but they’re critical for making AI results reproducible and reliable.
Respondents
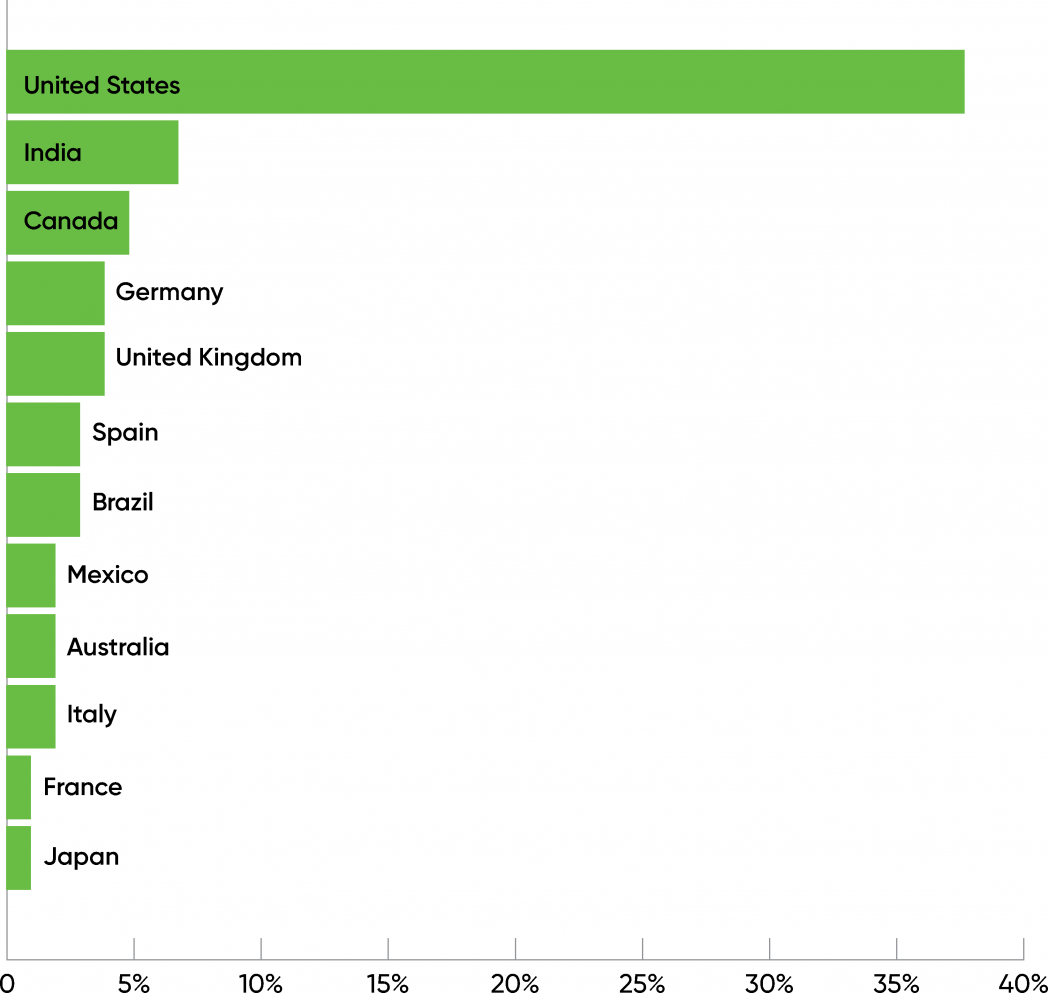
Of the 3,574 respondents who completed this year’s survey, 3,099 were working with AI in some way: considering it, evaluating it, or putting products into production. Of these respondents, it’s not a surprise that the largest number are based in the United States (39%) and that roughly half were from North America (47%). India had the second-most respondents (7%), while Asia (including India) had 16% of the total. Australia and New Zealand accounted for 3% of the total, giving the Asia-Pacific (APAC) region 19%. A little over a quarter (26%) of respondents were from Europe, led by Germany (4%). 7% of the respondents were from South America, and 2% were from Africa. Except for Antarctica, there were no continents with zero respondents, and a total of 111 countries were represented. These results that interest and use of AI is worldwide and growing.
This year’s results match last year’s data well. But it’s equally important to notice what the data doesn’t say. Only 0.2% of the respondents said they were from China. That clearly doesn’t reflect reality; China is a leader in AI and probably has more AI developers than any other nation, including the US. Likewise, 1% of the respondents were from Russia. Purely as a guess, we suspect that the number of AI developers in Russia is slightly smaller than the number in the US. These anomalies say much more about who the survey reached (subscribers to O’Reilly’s newsletters) than they say about the actual number of AI developers in Russia and China.
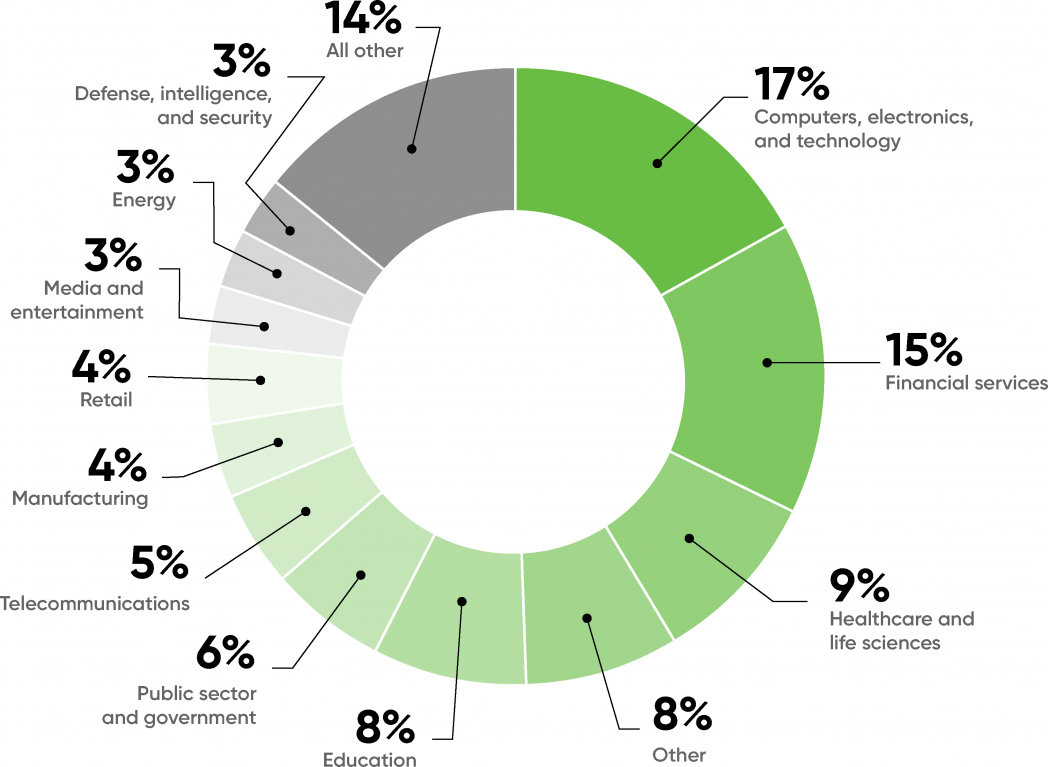
The respondents represented a diverse range of industries. Not surprisingly, computers, electronics, and technology topped the charts, with 17% of the respondents. Financial services (15%), healthcare (9%), and education (8%) are the industries making the next-most significant use of AI. We see relatively little use of AI in the pharmaceutical and chemical industries (2%), though we expect that to change sharply given the role of AI in developing the COVID-19 vaccine. Likewise, we see few respondents from the automotive industry (2%), though we know that AI is key to new products such as autonomous vehicles.
3% of the respondents were from the energy industry, and another 1% from public utilities (which includes part of the energy sector). That’s a respectable number by itself, but we have to ask: Will AI play a role in rebuilding our frail and outdated energy infrastructure, as events of the last few years—not just the Texas freeze or the California fires—have demonstrated? We expect that it will, though it’s fair to ask whether AI systems trained on normative data will be robust in the face of “black swan” events. What will an AI system do when faced with a rare situation, one that isn’t well-represented in its training data? That, after all, is the problem facing the developers of autonomous vehicles. Driving a car safely is easy when the other traffic and pedestrians all play by the rules. It’s only difficult when something unexpected happens. The same is true of the electrical grid.
We also expect AI to reshape agriculture (1% of respondents). As with energy, AI-driven changes won’t come quickly. However, we’ve seen a steady stream of AI projects in agriculture, with goals ranging from detecting crop disease to killing moths with small drones.
Finally, 8% of respondents said that their industry was “Other,” and 14% were grouped into “All Others.” “All Others” combines 12 industries that the survey listed as possible responses (including automotive, pharmaceutical and chemical, and agriculture) but that didn’t have enough responses to show in the chart. “Other” is the wild card, comprising industries we didn’t list as options. “Other” appears in the fourth position, just behind healthcare. Unfortunately, we don’t know which industries are represented by that category—but it shows that the spread of AI has indeed become broad!
Maturity
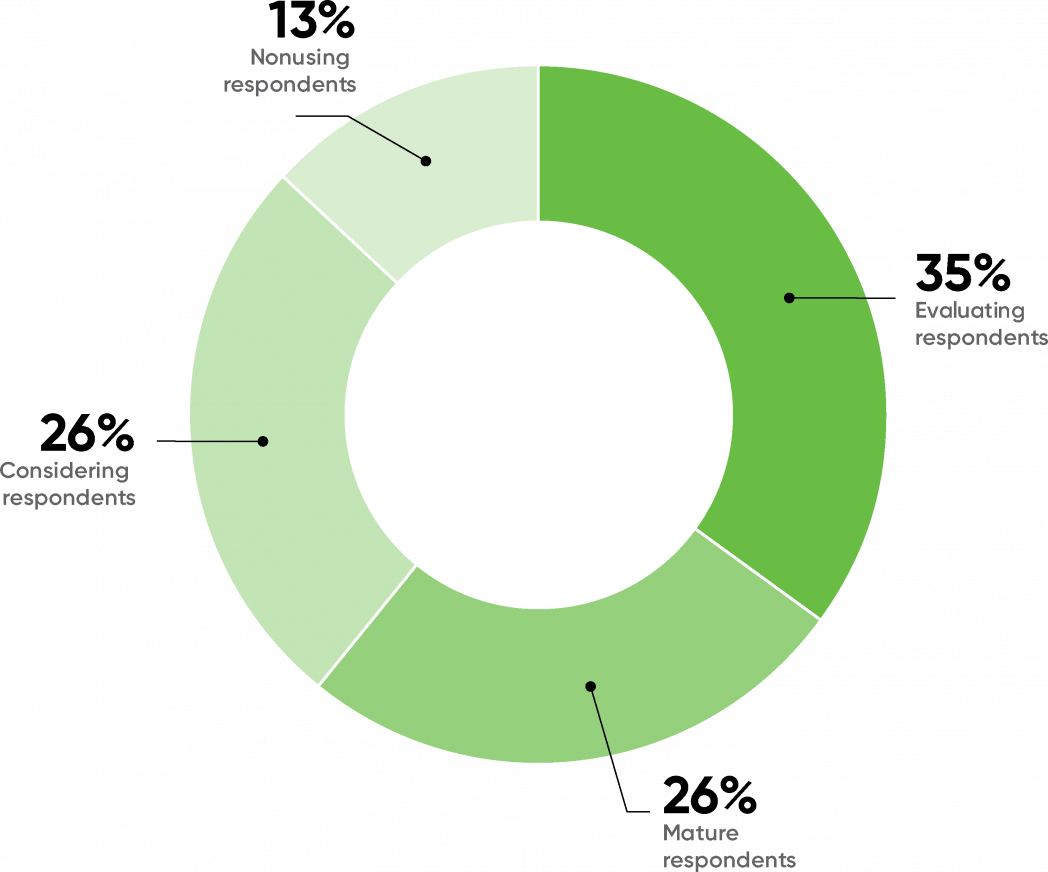
Roughly one quarter of the respondents described their use of AI as “mature” (26%), meaning that they had revenue-bearing AI products in production. This is almost exactly in line with the results from 2020, where 25% of the respondents reported that they had products in production (“Mature” wasn’t a possible response in the 2020 survey.)
This year, 35% of our respondents were “evaluating” AI (trials and proof-of-concept projects), also roughly the same as last year (33%). 13% of the respondents weren’t making use of AI or considering using it; this is down from last year’s number (15%), but again, it’s not significantly different.
What do we make of the respondents who are “considering” AI but haven’t yet started any projects (26%)? That’s not an option last year’s respondents had. We suspect that last year respondents who were considering AI said they were either “evaluating” or “not using” it.
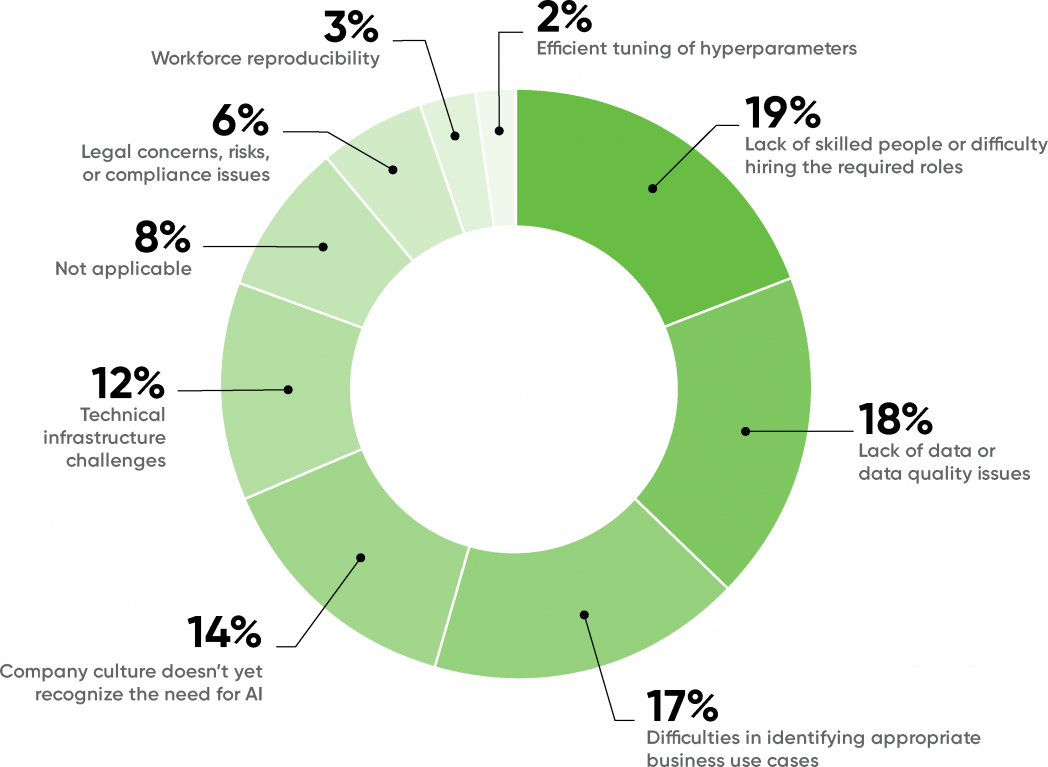
Looking at the problems respondents faced in AI adoption provides another way to gauge the overall maturity of AI as a field. Last year, the major bottleneck holding back adoption was company culture (22%), followed by the difficulty of identifying appropriate use cases (20%). This year, cultural problems are in fourth place (14%) and finding appropriate use cases is in third (17%). That’s a very significant change, particularly for corporate culture. Companies have accepted AI to a much greater degree, although finding appropriate problems to solve still remains a challenge.
The biggest problems in this year’s survey are lack of skilled people and difficulty in hiring (19%) and data quality (18%). It’s no surprise that the demand for AI expertise has exceeded the supply, but it’s important to realize that it’s now become the biggest bar to wider adoption. The biggest skills gaps were ML modelers and data scientists (52%), understanding business use cases (49%), and data engineering (42%). The need for people managing and maintaining computing infrastructure was comparatively low (24%), hinting that companies are solving their infrastructure requirements in the cloud.
It’s gratifying to note that organizations starting to realize the importance of data quality (18%). We’ve known about “garbage in, garbage out” for a long time; that goes double for AI. Bad data yields bad results at scale.
Hyperparameter tuning (2%) wasn’t considered a problem. It’s at the bottom of the list—where, we hope, it belongs. That may reflect the success of automated tools for building models (AutoML, although as we’ll see later, most respondents aren’t using them). It’s more concerning that workflow reproducibility (3%) is in second-to-last place. This makes sense, given that we don’t see heavy usage of tools for model and data versioning. We’ll look at this later, but being able to reproduce experimental results is critical to any science, and it’s a well-known problem in AI.
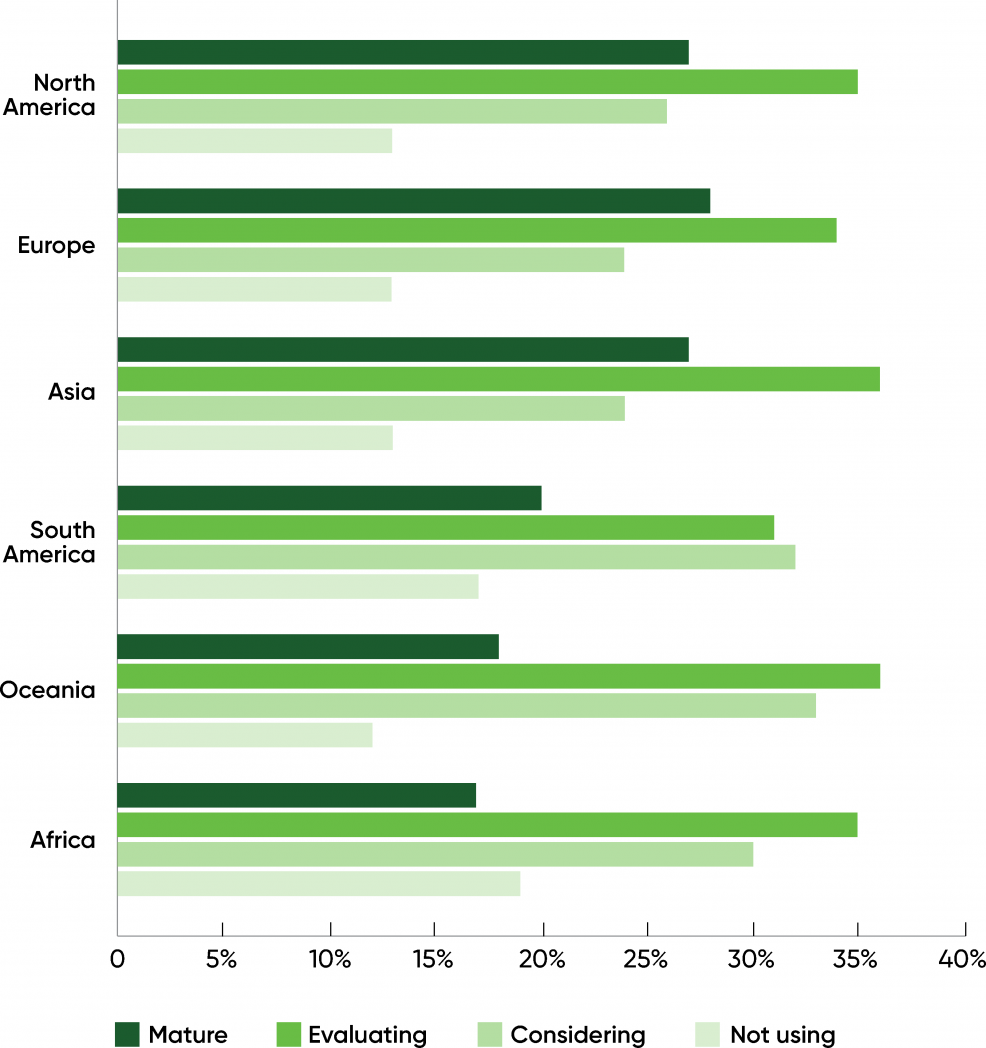
Maturity by Continent
When looking at the geographic distribution of respondents with mature practices, we found almost no difference between North America (27%), Asia (27%), and Europe (28%). In contrast, in our 2018 report, Asia was behind in mature practices, though it had a markedly higher number of respondents in the “early adopter” or “exploring” stages. Asia has clearly caught up. There’s no significant difference between these three continents in our 2021 data.
We found a smaller percentage of respondents with mature practices and a higher percentage of respondents who were “considering” AI in South America (20%), Oceania (Australia and New Zealand, 18%), and Africa (17%). Don’t underestimate AI’s future impact on any of these continents.
Finally, the percentage of respondents “evaluating” AI was almost the same on each continent, varying only from 31% (South America) to 36% (Oceania).
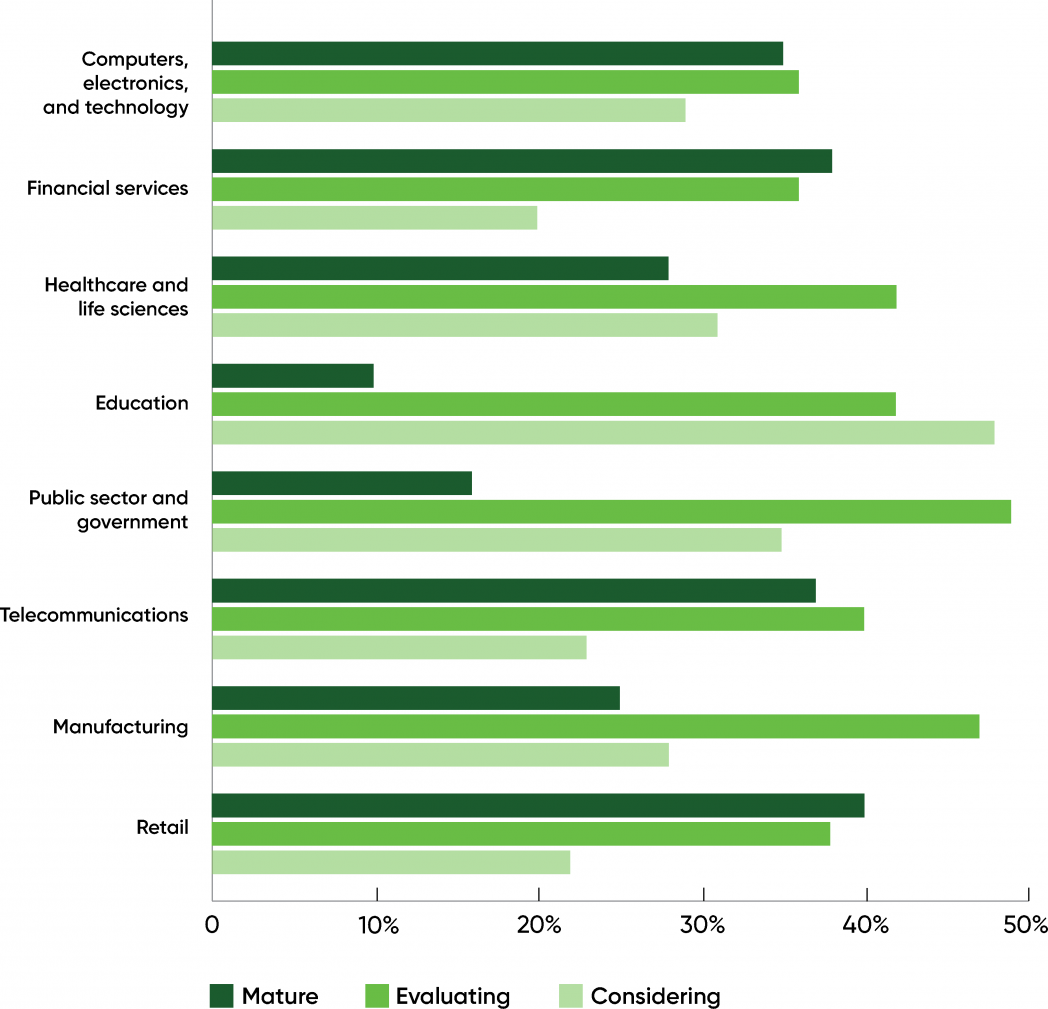
Maturity by Industry
While AI maturity doesn’t depend strongly on geography, we see a different picture if we look at maturity by industry.
Looking at the top eight industries, financial services (38%), telecommunications (37%), and retail (40%) had the greatest percentage of respondents reporting mature practices. And while it had by far the greatest number of respondents, computers, electronics, and technology was in fourth place, with 35% of respondents reporting mature practices. Education (10%) and government (16%) were the laggards. Healthcare and life sciences, at 28%, were in the middle, as were manufacturing (25%), defense (26%), and media (29%).
On the other hand, if we look at industries that are considering AI, we find that education is the leader (48%). Respondents working in government and manufacturing seem to be somewhat further along, with 49% and 47% evaluating AI, meaning that they have pilot or proof-of-concept projects in progress.
This may just be a trick of the numbers: every group adds up to 100%, so if there are fewer “mature” practices in one group, the percentage of “evaluating” and “considering” practices has to be higher. But there’s also a real signal: respondents in these industries may not consider their practices “mature,” but each of these industry sectors had over 100 respondents, and education had almost 250. Manufacturing needs to automate many processes (from assembly to inspection and more); government has been as challenged as any industry by the global pandemic, and has always needed ways to “do more with less”; and education has been experimenting with technology for a number of years now. There is a real desire to do more with AI in these fields. It’s worth pointing out that educational and governmental applications of AI frequently raise ethical questions—and one of the most important issues for the next few years will be seeing how these organizations respond to ethical problems.
The Practice of AI
Now that we’ve discussed where mature practices are found, both geographically and by industry, let’s see what a mature practice looks like. What do these organizations have in common? How are they different from organizations that are evaluating or considering AI?
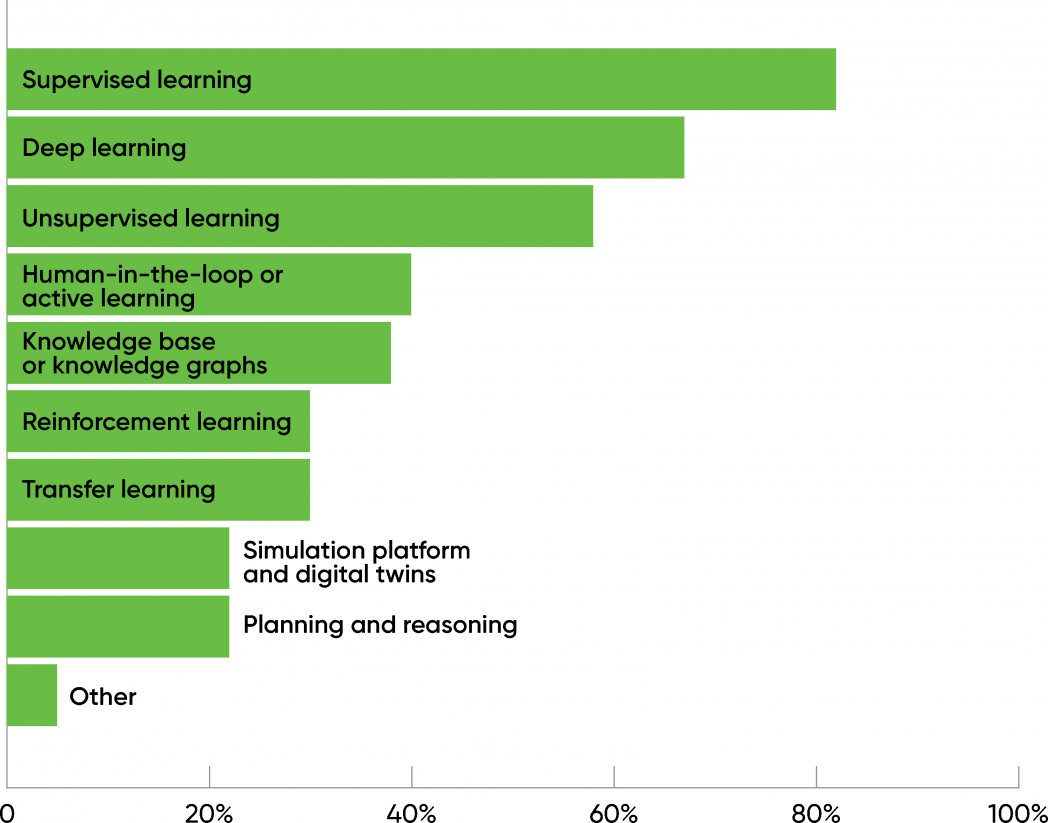
Techniques
First, 82% of the respondents are using supervised learning, and 67% are using deep learning. Deep learning is a set of algorithms that are common to almost all AI approaches, so this overlap isn’t surprising. (Participants could provide multiple answers.) 58% claimed to be using unsupervised learning.
After unsupervised learning, there was a significant drop-off. Human-in-the-loop, knowledge graphs, reinforcement learning, simulation, and planning and reasoning all saw usage below 40%. Surprisingly, natural language processing wasn’t in the picture at all. (A very small number of respondents wrote in “natural language processing” as a response, but they were only a small percentage of the total.) This is significant and definitely worth watching over the next few months. In the last few years, there have been many breakthroughs in NLP and NLU (natural language understanding): everyone in the industry has read about GPT-3, and many vendors are betting heavily on using AI to automate customer service call centers and similar applications. This survey suggests that those applications still haven’t moved into practice.
We asked a similar question to respondents who were considering or evaluating the use of AI (60% of the total). While the percentages were lower, the technologies appeared in the same order, with very few differences. This indicates that respondents who are still evaluating AI are experimenting with fewer technologies than respondents with mature practices. That suggests (reasonably enough) that respondents are choosing to “start simple” and limit the techniques that they experiment with.
Data
We also asked what kinds of data our “mature” respondents are using. Most (83%) are using structured data (logfiles, time series data, geospatial data). 71% are using text data—that isn’t consistent with the number of respondents who reported using NLP, unless “text” is being used generically to include any data that can be represented as text (e.g., form data). 52% of the respondents reported using images and video. That seems low relative to the amount of research we read about AI and computer vision. Perhaps it’s not surprising though: there’s no reason for business use cases to be in sync with academic research. We’d expect most business applications to involve structured data, form data, or text data of some kind. Relatively few respondents (23%) are working with audio, which remains very challenging.
Again, we asked a similar question to respondents who were evaluating or considering AI, and again, we received similar results, though the percentage of respondents for any given answer was somewhat smaller (4–5%).

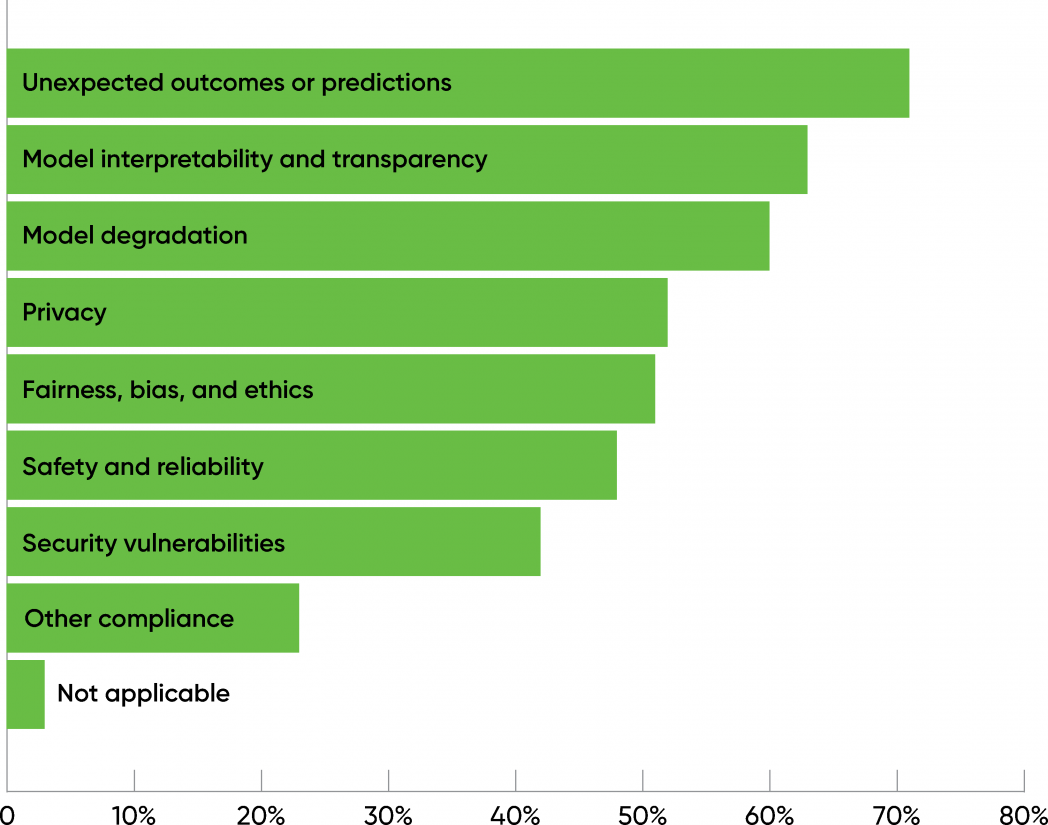
Risk
When we asked respondents with mature practices what risks they checked for, 71% said “unexpected outcomes or predictions.” Interpretability, model degradation over time, privacy, and fairness also ranked high (over 50%), though it’s disappointing that only 52% of the respondents selected this option. Security is also a concern, at 42%. AI raises important new security issues, including the possibility of poisoned data sources and reverse engineering models to extract private information.
It’s hard to interpret these results without knowing exactly what applications are being developed. Privacy, security, fairness, and safety are important concerns for every application of AI, but it’s also important to realize that not all applications are the same. A farming application that detects crop disease doesn’t have the same kind of risks as an application that’s approving or denying loans. Safety is a much bigger concern for autonomous vehicles than for personalized shopping bots. However, do we really believe that these risks don’t need to be addressed for nearly half of all projects?
Tools
Respondents with mature practices clearly had their favorite tools: scikit-learn, TensorFlow, PyTorch, and Keras each scored over 45%, with scikit-learn and TensorFlow the leaders (both with 65%). A second group of tools, including Amazon’s SageMaker (25%), Microsoft’s Azure ML Studio (21%), and Google’s Cloud ML Engine (18%), clustered around 20%, along with Spark NLP and spaCy.
When asked which tools they planned to incorporate over the coming 12 months, roughly half of the respondents answered model monitoring (57%) and model visualization (49%). Models become stale for many reasons, not the least of which is changes in human behavior, changes for which the model itself may be responsible. The ability to monitor a model’s performance and detect when it has become “stale” will be increasingly important as businesses grow more reliant on AI and in turn demand that AI projects demonstrate their value.
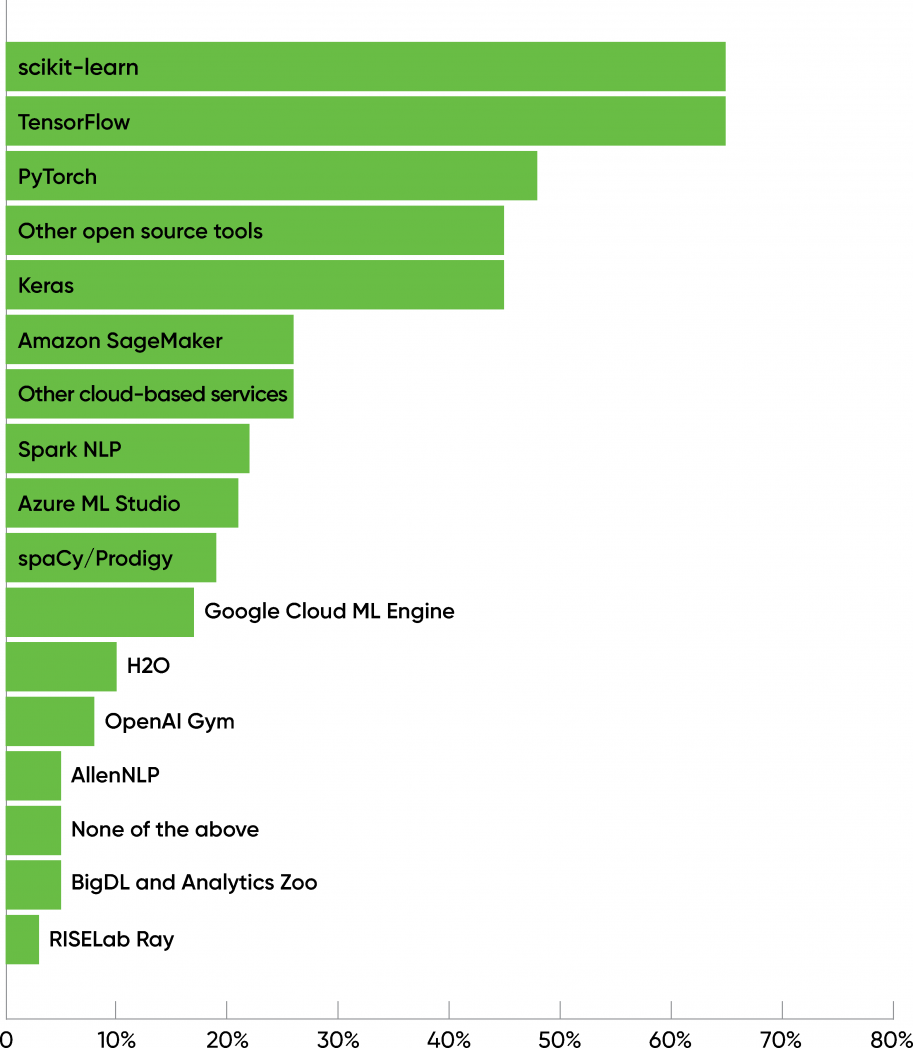
Responses from those who were evaluating or considering AI were similar, but with some interesting differences: scikit-learn moved from first place to third (48%). The second group was led by products from cloud vendors that incorporate AutoML: Microsoft Azure ML Studio (29%), Google Cloud ML Engine (25%), and Amazon SageMaker (23%). These products were significantly more popular than they were among “mature” users. The difference isn’t huge, but it is striking. At risk of over-overinterpreting, users who are newer to AI are more inclined to use vendor-specific packages, more inclined to use AutoML in one of its incarnations, and somewhat more inclined to go with Microsoft or Google rather than Amazon. It’s also possible that scikit-learn has less brand recognition among those who are relatively new to AI compared to packages from organizations like Google or Facebook.
When asked specifically about AutoML products, 51% of “mature” respondents said they weren’t using AutoML at all. 22% use Amazon SageMaker; 16% use Microsoft Azure AutoML; 14% use Google Cloud AutoML; and other tools were all under 10%. Among users who are evaluating or considering AI, only 40% said they weren’t using AutoML at all—and the Google, Microsoft, and Amazon packages were all but tied (27–28%). AutoML isn’t yet a big part of the picture, but it appears to be gaining traction among users who are still considering or experimenting with AI. And it’s possible that we’ll see increased use of AutoML tools among mature users, of whom 45% indicated that they would be incorporating tools for automated model search and hyperparameter tuning (in a word, AutoML) in the coming yet.
Deployment and Monitoring
An AI project means nothing if it can’t be deployed; even projects that are only intended for internal use need some kind of deployment. Our survey showed that AI deployment is still largely unknown territory, dominated by homegrown ad hoc processes. The three most significant tools for deploying AI all had roughly 20% adoption: MLflow (22%), TensorFlow Extended, a.k.a. TFX (20%), and Kubeflow (18%). Three products from smaller startups—Domino, Seldon, and Cortex—had roughly 4% adoption. But the most frequent answer to this question was “none of the above” (46%). Since this question was only asked of respondents with “mature” AI practices (i.e., respondents who have AI products in production), we can only assume that they’ve built their own tools and pipelines for deployment and monitoring. Given the many forms that an AI project can take, and that AI deployment is still something of a dark art, it isn’t surprising that AI developers and operations teams are only starting to adopt third-party tools for deployment.
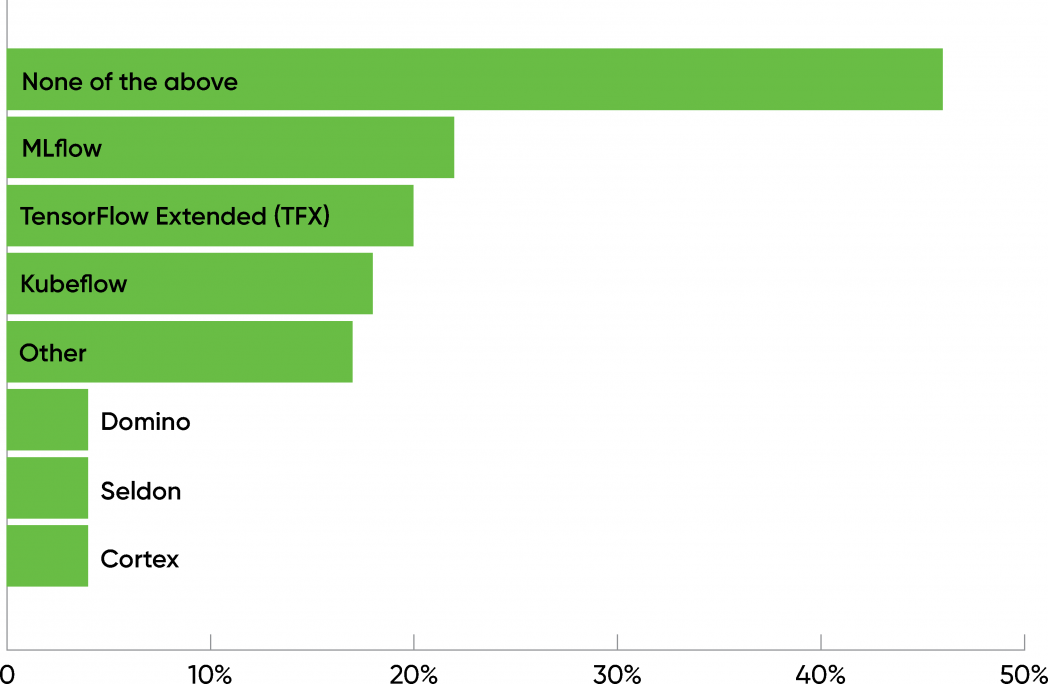
and monitoring
Versioning
Source control has long been a standard practice in software development. There are many well-known tools used to build source code repositories.
We’re confident that AI projects use source code repositories such as Git or GitHub; that’s a standard practice for all software developers. However, AI brings with it a different set of problems. In AI systems, the training data is as important as, if not more important than, the source code. So is the model built from the training data: the model reflects the training data and hyperparameters, in addition to the source code itself, and may be the result of hundreds of experiments.
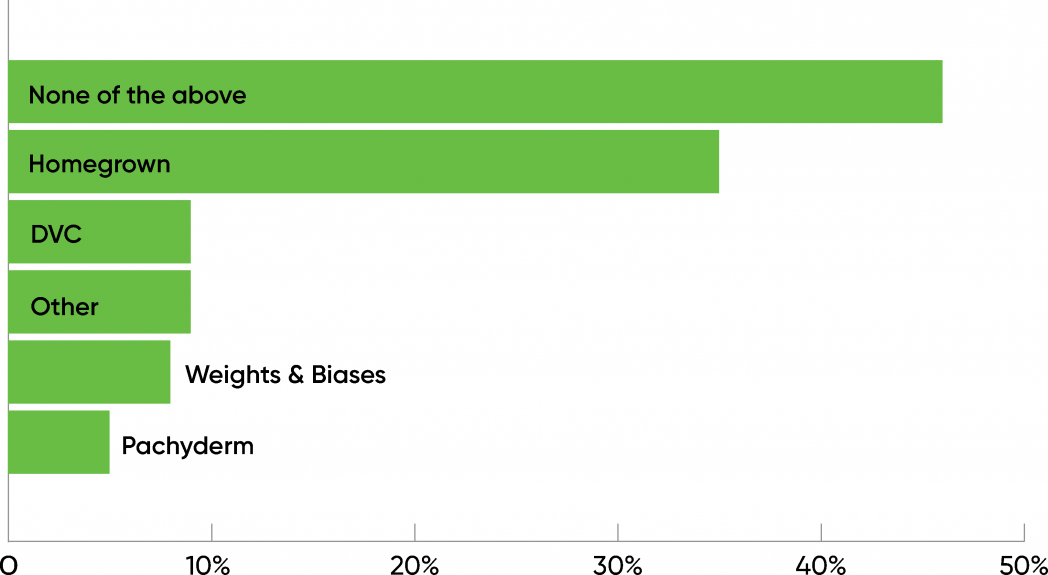
Our survey shows that AI developers are only starting to use tools for data and model versioning. For data versioning, 35% of the respondents are using homegrown tools, while 46% responded “none of the above,” which we take to mean they’re using nothing more than a database. 9% are using DVC, 8% are using tools from Weights & Biases, and 5% are using Pachyderm.
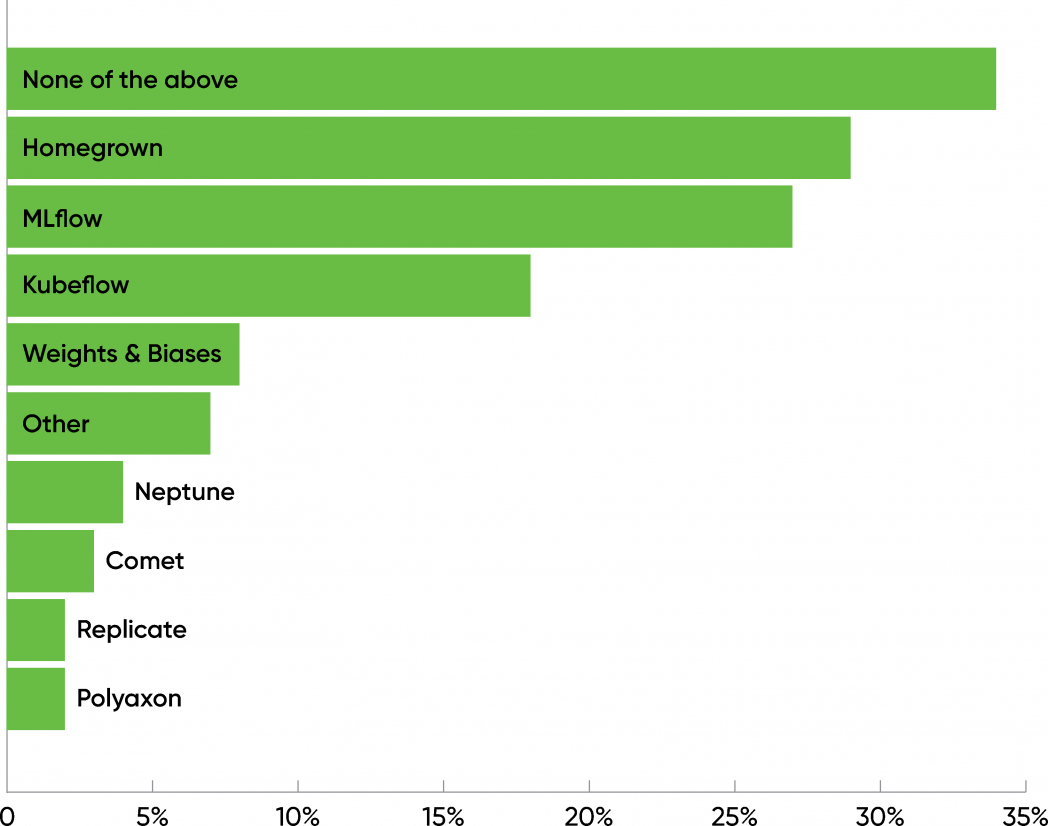
Tools for model and experiment tracking were used more frequently, although the results are fundamentally the same. 29% are using homegrown tools, while 34% said “none of the above.” The leading tools were MLflow (27%) and Kubeflow (18%), with Weights & Biases at 8%.
Respondents who are considering or evaluating AI are even less likely to use data versioning tools: 59% said “none of the above,” while only 26% are using homegrown tools. Weights & Biases was the most popular third-party solution (12%). When asked about model and experiment tracking, 44% said “none of the above,” while 21% are using homegrown tools. It’s interesting, though, that in this group, MLflow (25%) and Kubeflow (21%) ranked above homegrown tools.
Although the tools available for versioning models and data are still rudimentary, it’s disturbing that so many practices, including those that have AI products in production, aren’t using them. You can’t reproduce results if you can’t reproduce the data and the models that generated the results. We’ve said that a quarter of respondents considered their AI practice mature—but it’s unclear what maturity means if it doesn’t include reproducibility.
The Bottom Line
In the past two years, the audience for AI has grown, but it hasn’t changed much: Roughly the same percentage of respondents consider themselves to be part of a “mature” practice; the same industries are represented, and at roughly the same levels; and the geographical distribution of our respondents has changed little.
We don’t know whether to be gratified or discouraged that only 50% of the respondents listed privacy or ethics as a risk they were concerned about. Without data from prior years, it’s hard to tell whether this is an improvement or a step backward. But it’s difficult to believe that there are so many AI applications for which privacy, ethics, and security aren’t significant risks.
Tool usage didn’t present any big surprises: the field is dominated by scikit-learn, TensorFlow, PyTorch, and Keras, though there’s a healthy ecosystem of open source, commercially licensed, and cloud native tools. AutoML has yet to make big inroads, but respondents representing less mature practices seem to be leaning toward automated tools and are less likely to use scikit-learn.
The number of respondents who aren’t addressing data or model versioning was an unwelcome surprise. These practices should be foundational: central to developing AI products that have verifiable, repeatable results. While we acknowledge that versioning tools appropriate to AI applications are still in their early stages, the number of participants who checked “none of the above” was revealing—particularly since “the above” included homegrown tools. You can’t have reproducible results if you don’t have reproducible data and models. Period.
In the past year, AI in the enterprise has grown; the sheer number of respondents will tell you that. But has it matured? Many new teams are entering the field, while the percentage of respondents who have deployed applications has remained roughly constant. In many respects, this indicates success: 25% of a bigger number is more than 25% of a smaller number. But is application deployment the right metric for maturity? Enterprise AI won’t really have matured until development and operations groups can engage in practices like continuous deployment, until results are repeatable (at least in a statistical sense), and until ethics, safety, privacy, and security are primary rather than secondary concerns. Mature AI? Yes, enterprise AI has been maturing. But it’s time to set the bar for maturity higher.